
S&P 500, Nasdaq, Dow Jones Forecast for the Week Ahead: Into the FOMC
Article
Today 9:00 AM

Technical analysis is one method of studying market movements. You can think of it as a toolbox for building your trading strategy. In this lesson, we’ll take a look at what technical analysis is and whether it works.
Technical analysis is the use of charts and statistics to analyse the direction of markets and identify entry and exit points for trades. Traders who use it will look to find opportunities from changes in price, volume, momentum and implied volatility.
You might have heard that markets are random. But when you look at price action over any period of time, you’ll start to notice trends and patterns. Technical analysts believe that looking at these regular historical occurrences can hold the key to future price movements.
Markets repeat themselves – these repetitions might not be identical, but they have the same structure. So, if you see a pattern emerging, the chances are others can too. This is what makes technical analysis almost a self-fulfilling trend.
In order to identify these opportunities, technicians use charts, indicators and drawing tools, which we’ll take a closer look at over the next few lessons. You might’ve heard of some of the more popular ones already, including bar charts and candlesticks, moving averages and Bollinger bands.
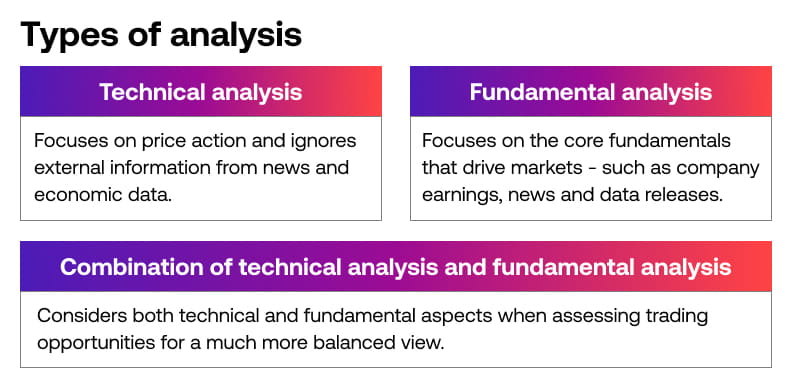
While technical analysis purely looks at prices and patterns, fundamental analysis involves any research into an asset’s ‘real price’. This can include monitoring events, financial statements and macroeconomic data.
The advantages of technical analysis are that you can look at pretty much any trading instrument regardless of whether you have a short-term or long-term timeframe in mind. In fact, technical analysis can be applied to price movements that last just minutes.
You can choose to focus solely on fundamental or technical analysis, but most traders will combine the two for a more well-rounded view of the markets.
Want to learn more about fundamental analysis? Take a look at our course.
Technical analysis works depending on what you’re expecting from it. If you’re hoping it’ll lay out a complete step-by-step of what to trade and when, you could be sorely disappointed.
It reveals just one part of the bigger picture of what’s going on with a market’s price.
In fact, charts are nothing more than a depiction of market sentiment. They show us the mood of investors and speculators, whether they’re optimistic or pessimistic about the price. But they don’t show us the context in which that sits. That’s why technical analysis is commonly referred to as the study of behavioural finance.
For the most part, fundamental analysis helps to guide what you should buy and sell, whereas technical analysis gives you an idea of when to buy and sell it.
Most trading strategies will use technical analysis methods to create a set of clear rules and guidelines to assist in the decision-making process of when, where and how to enter and exit a trade.
Want to learn more about building strategies? Take a look at our beginners’ course.
The accuracy of technical analysis varies from trader to trader. To work out how accurate your technical analysis is, you can ‘backtest’ your strategy using historical data. You can compare how you thought the market would respond to what actually happened.
To start using technical analysis, you’ll first need to learn how to identify the current position of the market and assess where it will go from there – we’ll cover this in the next lesson.
Once you’ve got a sense of the potential movement, you can prepare your strategy for taking advantage of it.