


March 26, 2021 11:09 AM
Yields and Yen: A negative relationship
Yields and Yen are not friends. They actually have been running away from each other lately. However, this dysfunctional relationship has led to some nice profits for bond and Yen traders. With the benchmark US Treasury yield trading up at January 2020 levels, near 1.66% (pre-pandemic), the Yen has been moving the opposite direction. As a result, USD/JPY has been moving higher! The strong US Dollar is helping to lift USD/JPY too, but the strong US Dollar is also a result of higher US yields. Despite Fed Chairman Powell and his colleagues trying to talk interest rates this week, it appears that bond traders don’t believe the Fed hype and are pushing yields higher. As a result, the Yen is lower.
Everything you should know about the Japanese Yen
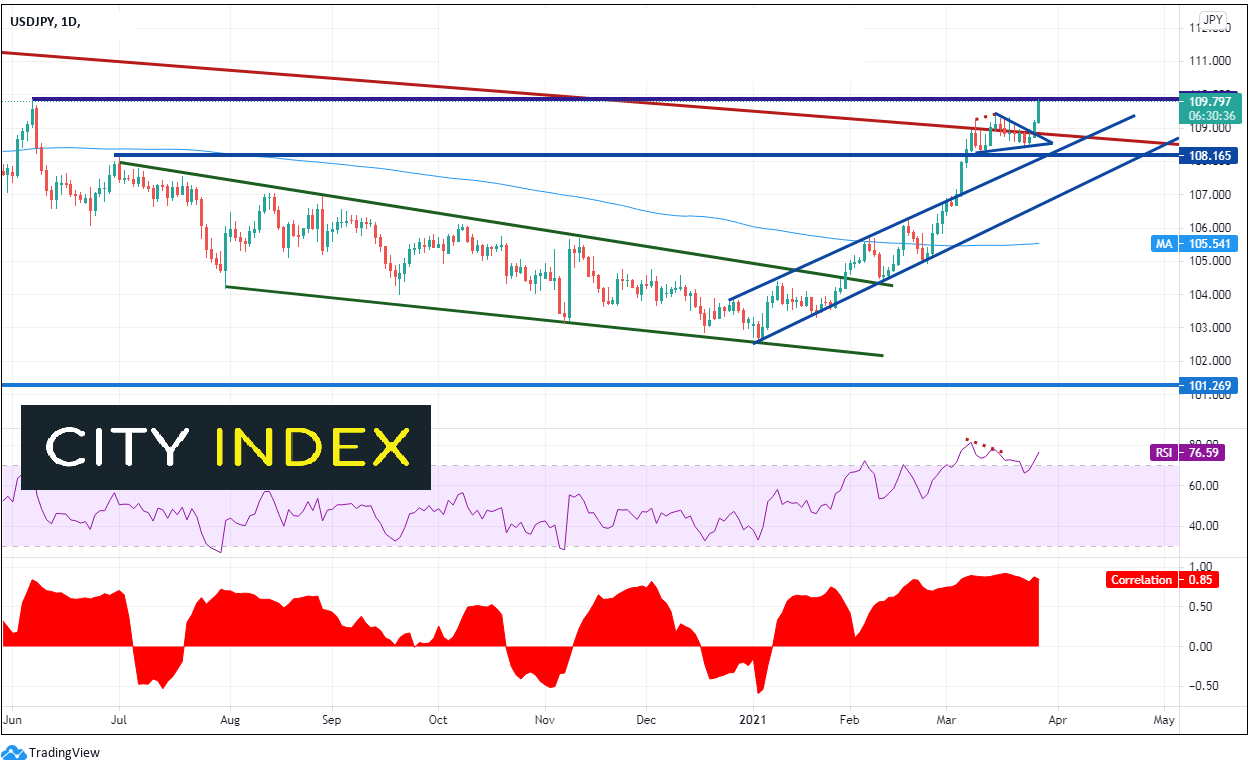
Take a look at the bottom of the daily chart below. The correlation coefficient between the US 10-year yield and USD/JPY is +0.85. A correlation coefficient of +1.00 means the 2 assets are perfectly correlated, so the current correlation is close. Remember: yields and Yen have an inverse relationship, so when yields for up, USD/JPY goes up as well (the JPY is going down).
Source, Tradingview, City Index
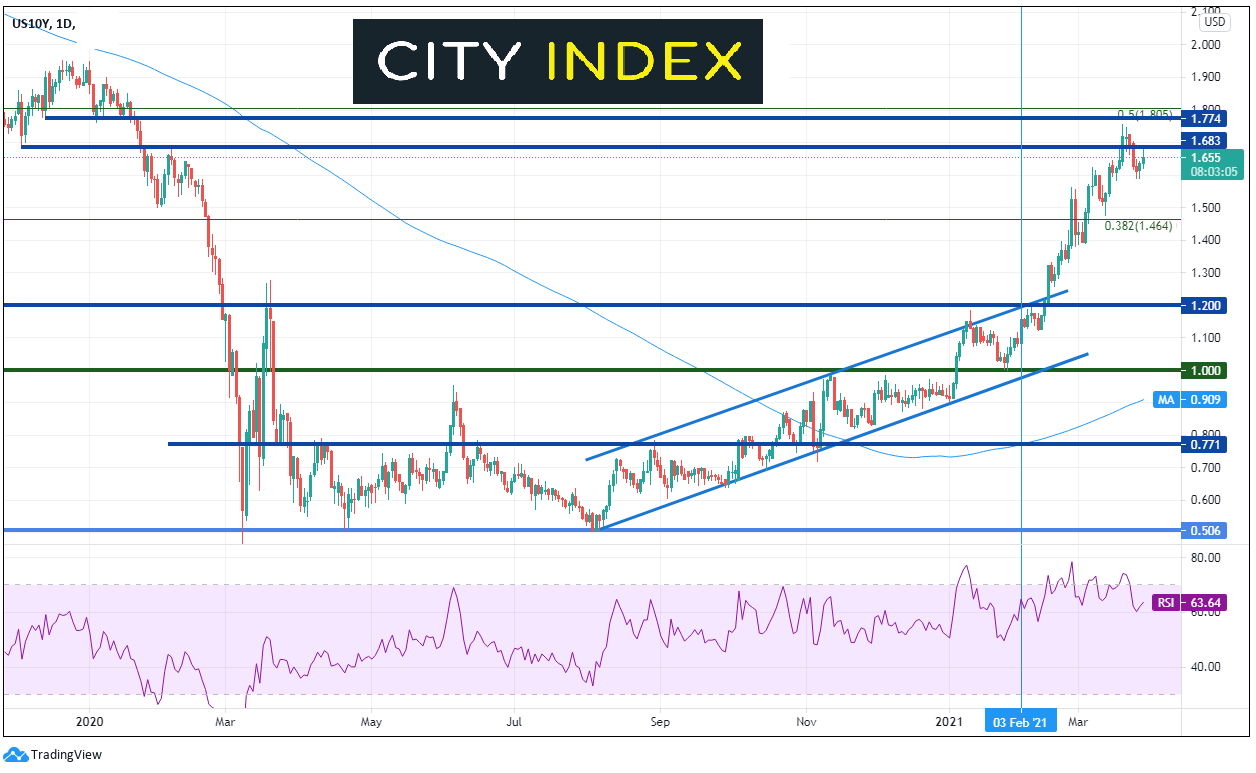
January 6th, 2020 was a historic day in the US. USD/JPY put in post-pandemic lows and began moving higher . The US Dollar Index also bottomed on January 6th. Incidentally, the riots at the capital took place on the same day! And the US 10-year yields, which had slowly been moving higher since the end of summer 2020, pushed through key resistance above the psychological round number of 1.00% and hasn’t looked back. A few weeks later, USD/JPY broke out of a downward sloping descending wedge (green) near 104.50 and moved aggressively higher, along with 10-year yields!
Source, Tradingview, City Index
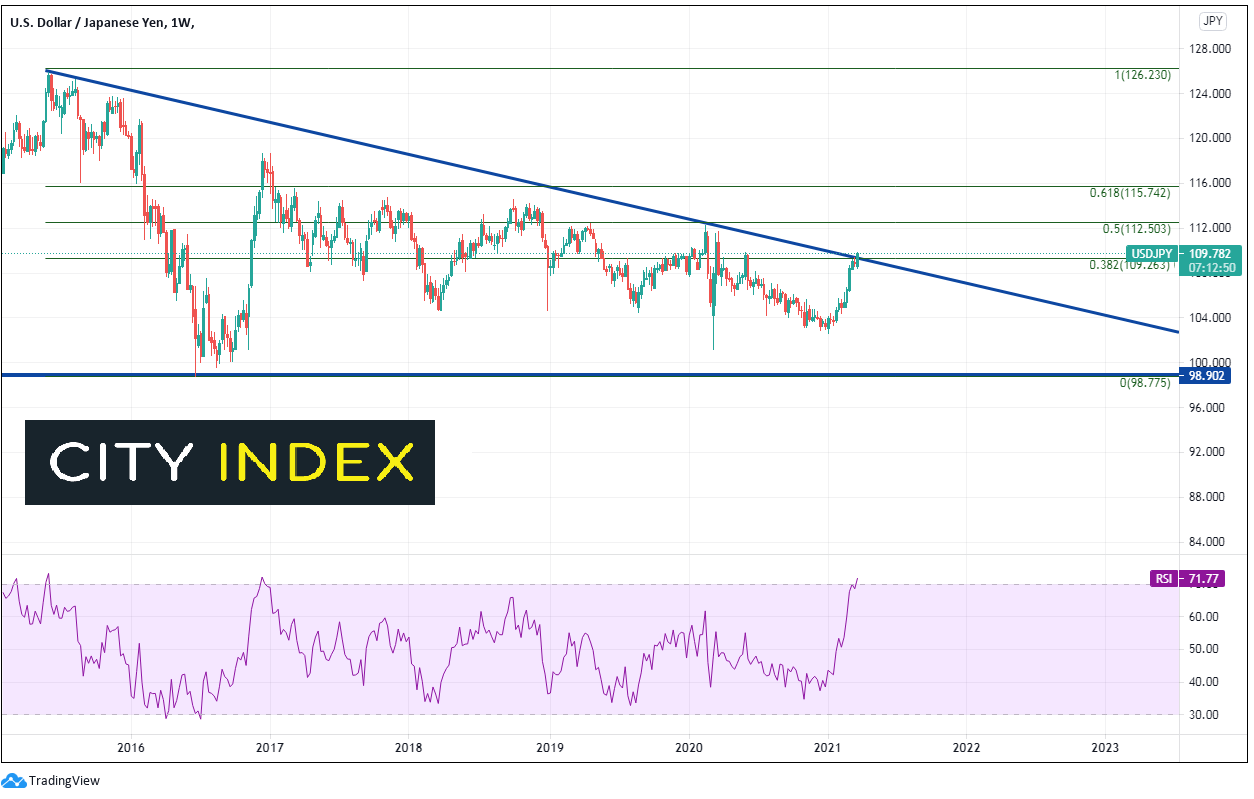
USD/JPY is at long term resistance on a weekly timeframe, allowing the pair to consolidate and the RSI to unwind. Not only is it at a downward sloping trendline dating back to June 2015, but the pair is also at the 38.2% Fibonacci retracement level from those June 2015 highs to the June 2016 lows, near 109.25. In addition, this week, the RSI has moved into overbought territory, a warning sign the pair may be ready for a pullback.
Source: Tradingview, City Index
Currently, the USD/JPY is breaking out above the weekly resistance and a daily short-term triangle. Meanwhile, yields are playing hard-to-get and have not broken out above their recent highs. As the USD/JPY runs into resistance at previous highs from June 8th, 2020 and the RSI returns to overbought conditions, traders need to consider whether the pair will pull back in order to maintain the (dys)functional relationship between yields and Yen. Or will the correlation begin to break? This is a relationship worth following!
Learn more about forex trading opportunities.
Latest market news
Yesterday 01:23 PM
Yesterday 06:01 AM
April 18, 2024 11:27 PM
Latest Forex articles
Yesterday 06:01 AM
April 17, 2024 02:40 PM
April 17, 2024 04:47 AM