


May 12, 2021 5:03 PM
Xiaomi: Off the blacklist! What now?
Earlier this week, Chinese smartphone marker Xiaomi Corp. was finally removed from the “Blacklist” which restricted Americans from investing in the company. It was placed on the list by the Trump Administration in January after being labeled a Communist Chinese Military Company. In March, a US Federal Judge placed a temporary halt on the US investment ban, noting that the US government’s process for determining that the firm was tied to the Chinese military was “deeply flawed”.
Technical Analysis
After a huge move higher from the March 2020 lows of 9.20 to the January 5th highs of 35.90, the pair moved lower in a corrective channel formation. The stock pulled back to the 50% retracement of the same time period, near 22.50. However, after a bounce on the news from March, Xiaomi began to trade in a range between 24.10 and 27.45. After a 6% move higher on Wednesday, the technology giant is bumping up against the top, downward sloping trendline of the channel from the January 5th highs. If price can break above horizontal resistance at 27.45, the next resistance is 32.40, ahead of the all-time highs near 35.85. That said, if the trendline resistance holds, first support is at the May 11th lows near 24.05. The next level of support is at the previously mentioned 50% retracement level near 22.50, then the March 9th lows at 20.65. The 61.8% Fibonacci retracement is just below there at 19.40.
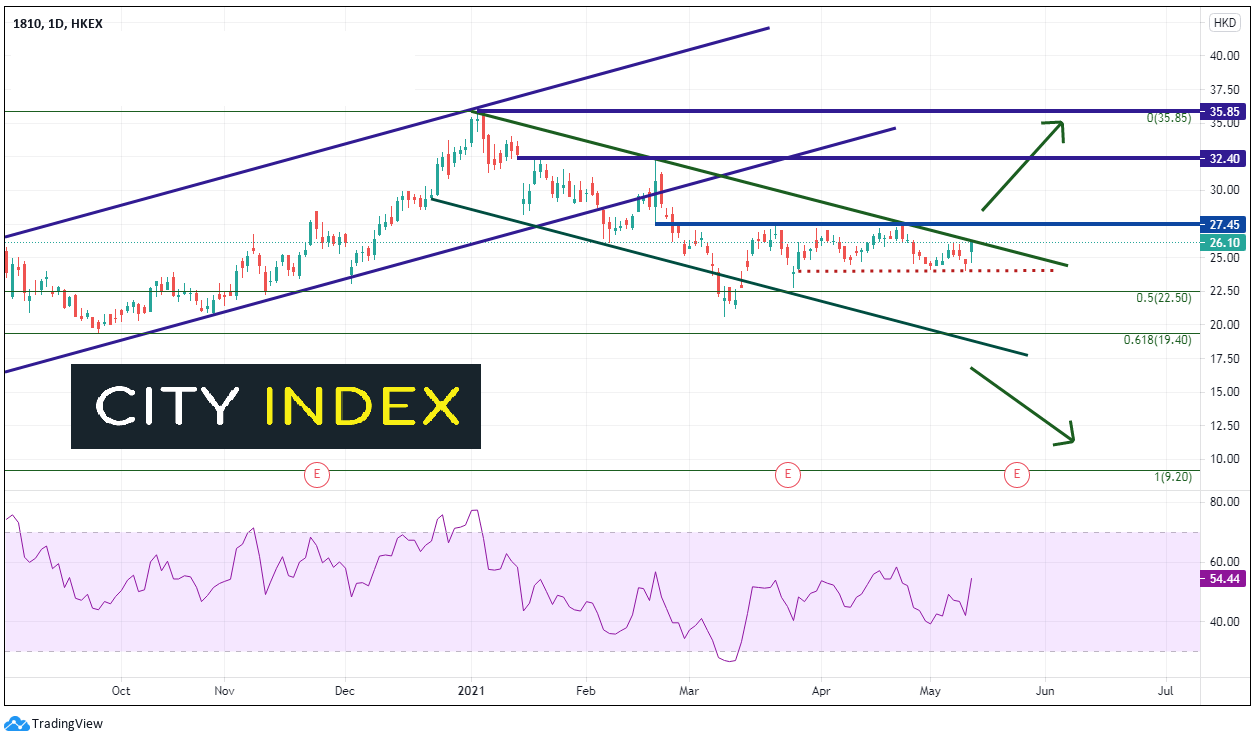
Source: Tradingview, City Index
Learn more about equity trading opportunities.
What about the Hang Seng?
As mentioned, Xiaomi popped 6% on the news of the removal from the US blacklist which helped push the Hang Seng higher for the day. However, with major stocks indices in the West down roughly 2.0% - 3.0%, the Hang Seng may get pulled lower, bringing shares of Xiaomi lower with it. The index moved higher in aggressive fashion from the lows of September 28th, 2020 to the highs of February 18th, 2021, near 21096. Since then, the Hang Seng has pulled back in a descending wedge formation to just below the 38.2% Fibonacci retracement level from the same time period. The 50% retracement level and horizontal support are below at 27024. The bottom trendline of the descending wedge also converges near this level. The 61.8% Fibonacci retracement level is the next level of support at 26063. The top trendline acts as the first level of resistance at 28750 . Horizontal resistance is above at 29306 and 30002. The 30000 level also acts as psychological round number resistance.
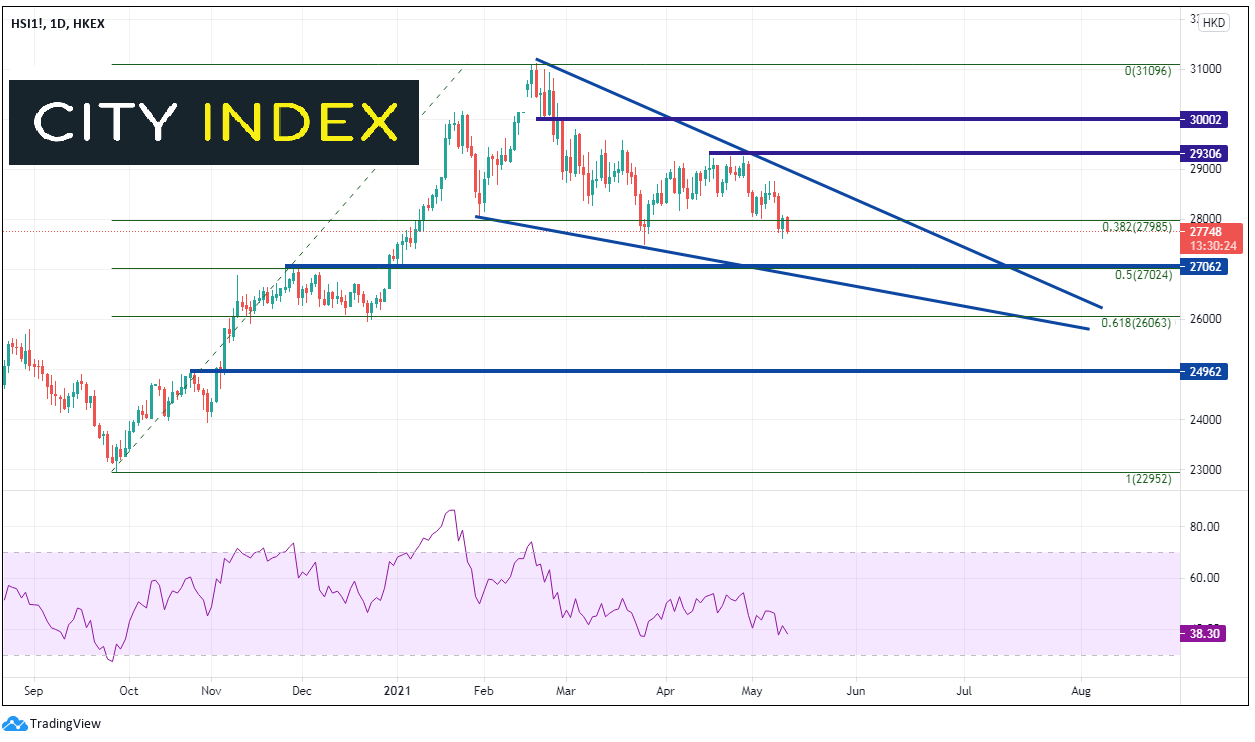
Source: Tradingview, City Index
Learn more about index trading opportunities.
Xiaomi got a nice boost in price after the news that the stock was removed from the blacklist of stocks that the US couldn’t invest in. However, with the steep selloff of stock markets in the US, traders need to consider if the Hang Seng will get dragged lower with it, and therefore, may bring Xiaomi lower as well.
Latest market news
Today 08:15 AM
Latest Tech Stocks articles
October 19, 2023 09:47 AM
October 18, 2023 12:06 PM
October 11, 2023 02:41 PM
October 3, 2023 12:24 PM