WTI drops on the back of sharp crude stocks build
The US Energy Information Administration (EIA) has published its usual Summary of Weekly Petroleum data about an hour and half or so ago. The report […]
The US Energy Information Administration (EIA) has published its usual Summary of Weekly Petroleum data about an hour and half or so ago. The report […]
The US Energy Information Administration (EIA) has published its usual Summary of Weekly Petroleum data about an hour and half or so ago. The report wasn’t what the bullish oil speculators wanted to see and exactly what the sellers had hoped for as it shows US crude inventories rose by a large 4.8 million barrels in the week ending December 11, 2015. This is significantly more than a small drawdown expected and also more than a rise of 2.3 million barrels that had been reported by the American Petroleum Institute last night. The details of the report were equally bearish as it wasn’t just total crude stockpiles that rose sharply. Stocks of oil products increased sharply too, with gasoline, not that it matters much at this time of the year, rising by 1.7 million barrels and more importantly distillates climbing by 2.6 million barrels, undoubtedly due to the milder temperatures which is reducing the need for heating. Meanwhile Cushing stocks rose by 607 thousand barrels, which was also an unexpected increase.
The EIA’s report was another piece of bad news for oil, after the International Energy Agency (IEA) last week said the global excess won’t be removed until the end of next year. Potential increases in Iranian oil production in 2016 and the resilient US shale production means the surplus will be even harder to eliminate. This evening’s FOMC statement could lead to a sharp rally in the dollar, if the Fed decides it is time to come out of ZIRP. This could be further bad news for buck-denominated commodities. But amidst all this doom and gloom, one should be wary of a surprise rally given, for example, that prices are severely oversold. We could be very close to a bottom, with both oil contracts being not too far off their December 2008 lows.
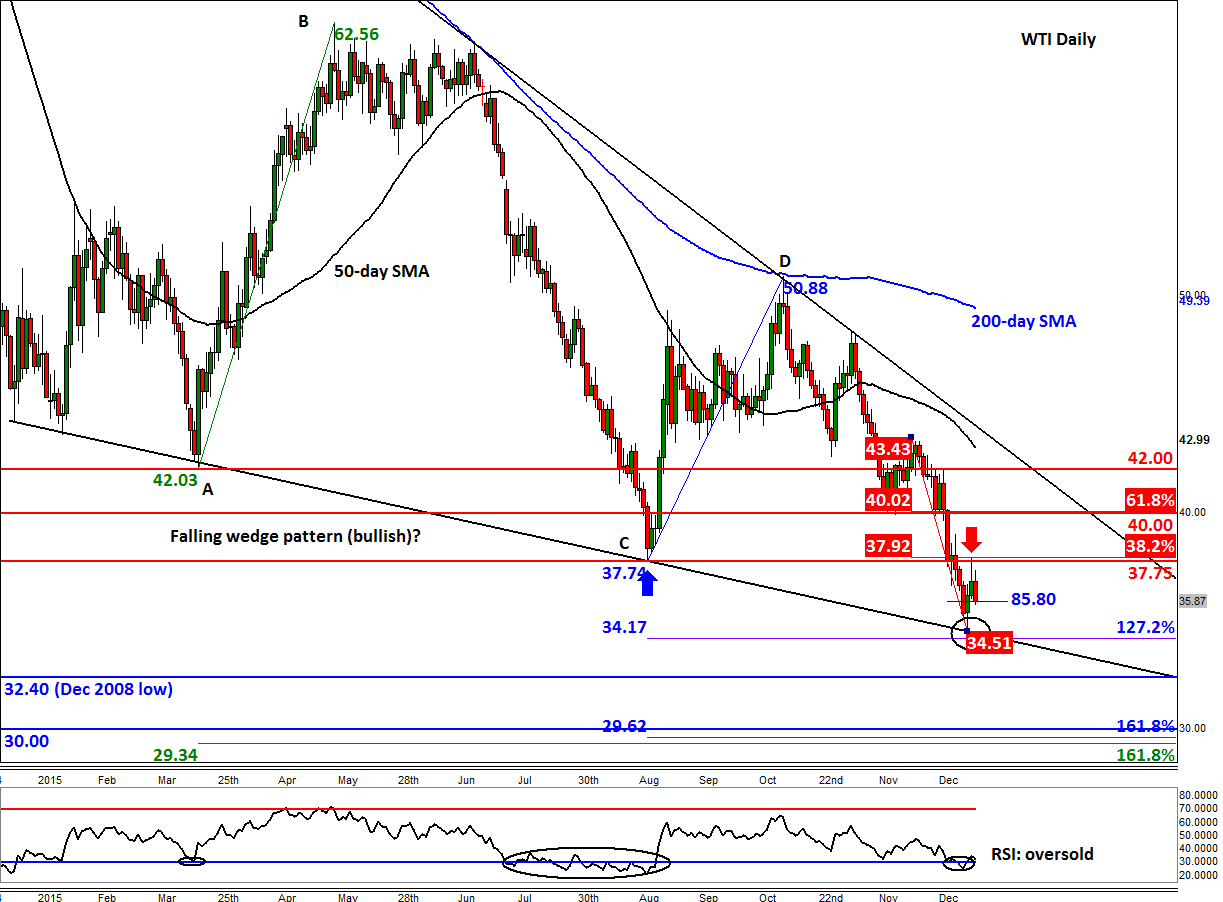
In fact, WTI has already dropped to a key support at $34.50, which corresponds with the lower of the two converging trend lines shown on the daily chart, below. So far however, the bounce from $34.50 has been a mild one, with oil running into strong resistance at the broken support and the 38.2% Fibonacci level of the most recent sell-off around the $37.75-$38.00 area. For WTI to stage a more meaningful rally, we will need this area to break down soon. And if WTI is indeed forming a bullish falling wedge pattern, it will also need to break through the resistance trend at some stage, which, around $42/$43, is still miles away. Until and unless that happens, bullish speculators should proceed with extra caution. Other near-term resistance levels include the psychological $40.00 handle which was also previously support and corresponds with the 61.8% Fibonacci retracement of the most recent downswing. But given the still-weak fundamental backdrop, WTI could easily revisit this week’s low at $34.50 or even break through it to test the December 2008 low at $32.40. Indeed, it could even fall to the psychologically-important $30 handle, which comes in less than a buck above the 161.8% Fibonacci extension levels of the previous corrective swings at $29.35 and $29.60, respectively. So there is still the scope for some further weakness, before we potentially see a near-term bottom.