WTI crude drops to 40 as oil stocks jump
WTI crude oil fell on the back of data from the US Department of Energy which showed US oil stockpiles rose by a sharp 9.4 […]
WTI crude oil fell on the back of data from the US Department of Energy which showed US oil stockpiles rose by a sharp 9.4 […]
WTI crude oil fell on the back of data from the US Department of Energy which showed US oil stockpiles rose by a sharp 9.4 million barrels last week. This more or less confirmed the data that was released by the American Petroleum Institute (API) the night before, but it still disappointed the expectations of a much smaller build. However crude stocks at Cushing fell, while gasoline inventories declined by a sharp 4.6 million barrels. So it wasn’t as bad a report as the headline figure made it out to be. Stockpiles have been rising relentlessly despite signs of lower oil output in recent months. But it should be noted that during this time of the year when refineries carry out their maintenance works ahead of the driving season, inventories do tend to rise. Thus, the build is not too much of a surprise. US oil inventories should begin to fall once the driving season starts, while the potential deal between Russia and the OPEC to freeze oil production should also help to reduce the imbalance between demand and supply in the oil market. For that reason, I don’t expect this to be the start of another major downward trend.
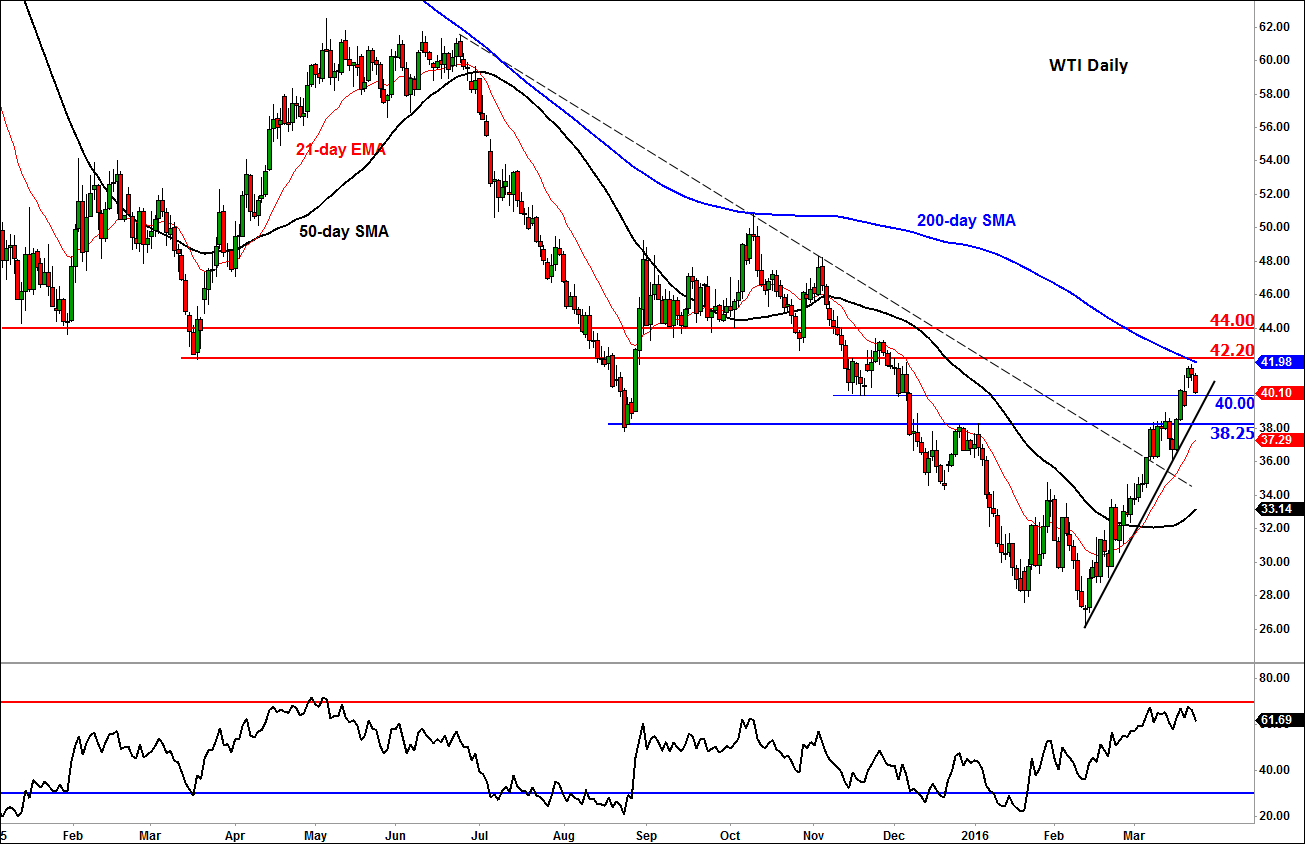
Indeed despite today’s sell-off, price action on both Brent and WTI has been looking bullish of late. So, this could just be a normal pullback in an upward trending market. While WTI may be pulling away from the still-declining 200-day moving average (which comes in around $42.00), the 50-day simple and the faster-moving 21-day exponential moving averages are both pointing higher now. At the time of this writing, WTI was testing the psychological $40 handle, although a more significant support level comes in somewhere in the region of $38.25 which was formerly resistance. The near-term outlook would only turn bearish if and when this level breaks down on daily closing basis.
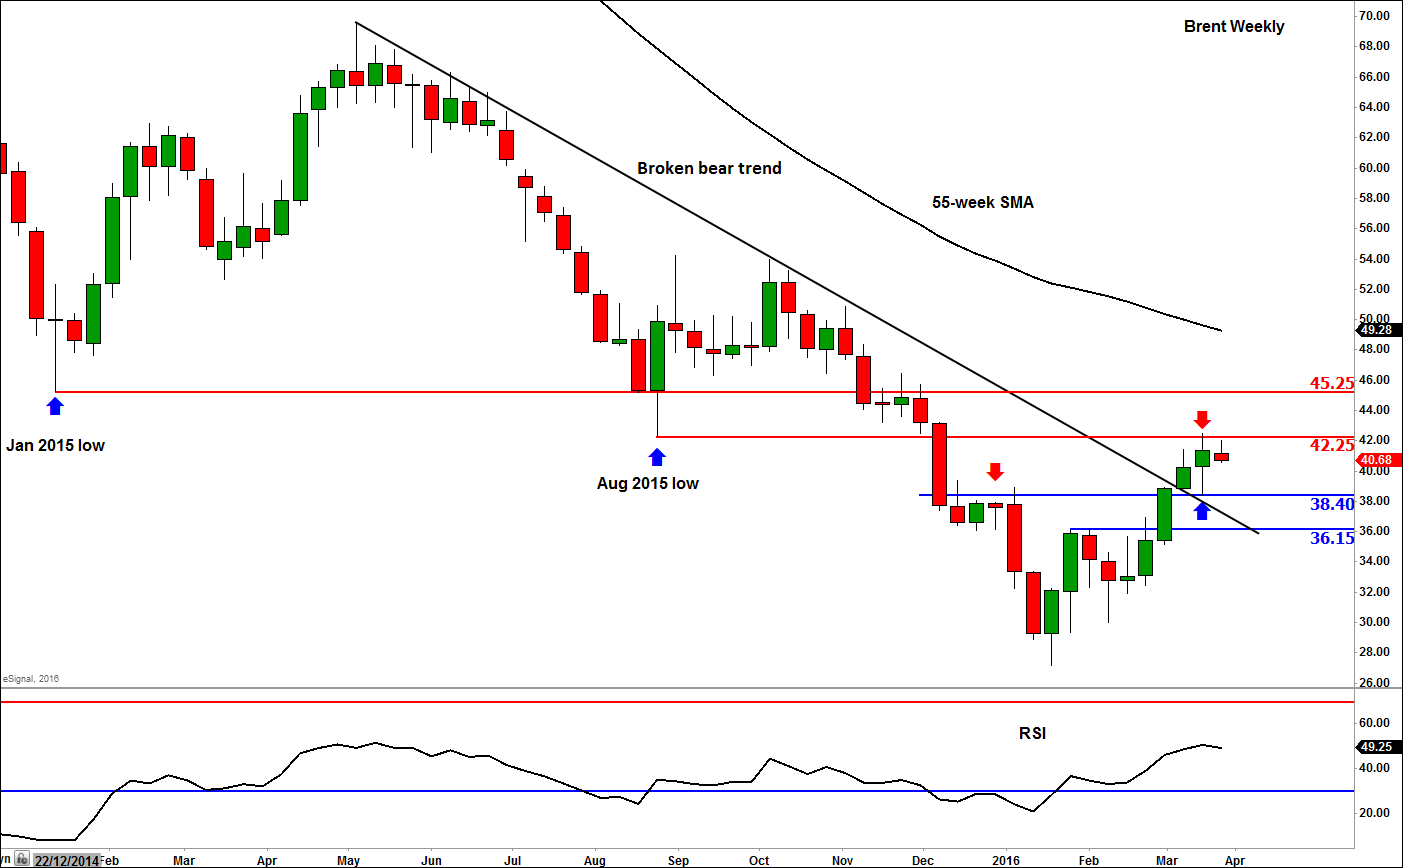
Meanwhile the weekly chart of Brent shows crude oil has found some resistance at the prior support level of $42.25, which was a temporary low established back in August 2015. This level is a key reference point for traders and the hesitation here should not come as a major surprise. Should we move above $42.25 at some point then it would strongly suggest that a more significant low has been established for oil. So far however the bears have managed to defend this key psychological hurdle. Another key reference point that needs to be monitored, should we get past $42.25, is the January 2015 low at $45.20/5.
While Brent oil holds below $42.25, a potential drop back towards old resistance-turned-support at $38.40 is a possibility. The medium term trend for Brent would only turn bearish if and when it moves back below the broken bearish trend line.