Why Dow 20K is good not 8220 great 8221
So the so-called ‘Trump trade’ strikes back and finally takes the Dow 20K prize.
So the so-called ‘Trump trade’ strikes back and finally takes the Dow 20K prize.
So the so-called ‘Trump trade’ strikes back and finally takes the Dow 20K prize. The President didn’t miss the chance to tag the largely symbolic win as partly his doing with an inevitable tweet —”Great! #Dow20K”.
Mostly though, Trump has had little directly to do with the trade flows named, not without irony, after him.
In a world of ‘animal spirits’ it seems to matter when the President rattles off a barrage of executive orders within days of taking office. Less so that they were already well-flagged, or that so far, are barely economically accretive: the wall along the border with Mexico, Obamacare repeal and certain temporary immigration controls.
A raft of solid quarterly figures by major-name companies is playing a bigger part. The tally of better-than-expected earnings now stands around 70% of the 100 or so S&P 500 firms to have reported so far. A busy, well-publicised slate of briefings with dozens of business leaders telegraphed optimism too.
And for now, market momentum continues to be partly fuelled by that optimism on Trump’s zeal for deregulation, tax cuts, and fiscal stimulus. But the same ‘Trump-flation’ uncertainties—lack of policy detail, a Republican rather than anti-establishment Congress—remain.
The question is whether the market is more or less at risk of a reversal now, than in late December. The 8-year uptrend is making many participants reluctant to opt for conventional logic, but that ascent also brought regular harsh lessons for uber-optimists. And right now, bullishness is pervasive. The Dow’s trailing P/E of 20.6 is the highest in 7 years. That sets a high bar for upside earnings surprises to justify the rich rating. The current Wall St consensus for Q4 earnings to grow 6.8% year-on-year—according to Thomson Reuters data—won’t quite cut it, if accurate.
Furthermore, most of the heavy lifting that powered the Dow to its magic barrier was done by relatively few market segments, mainly financials. Banks have been among the best performers since the election on 8th November, but Goldman Sachs alone accounts for some 170 points of the market’s 42-session surge above 19,000, the largest contribution by one stock. Together with rival JPMorgan, GS contributed 20% of the rise.
The other Trump risk, protectionist trade measures, is also not far from investors’ minds. Diplomatic language out of China this week, calling such a scenario a “lose-lose” situation, is a clear enough threat of retaliation against tariffs which Trump has said could be as high as 45%.
Still, the Dow’s largely symbolic importance for the American stock market is also of course blessing. DJIA is no longer a benchmark. Data from S&P Dow Jones Indices shows $35.9bn indexed against DJIA vs. $2.1T against the S&P 500. The most influential market participants will therefore take the Dow’s achievement of a nice round number as just that.
We can partly get round the slight pointlessness of technically analysing DJIA by looking at traded derivatives. Chicago Board of Trade’s e-mini future, charted below, is the closest corollary.
Like the underlying, the contract’s retracements within a reasonably clean channel since February 2016 have been sufficiently symmetrical and less than 100% of the preceding legs. (I am inclined to disregard the manic and short-lived breach of the parallel channel equating to the market’s flash of panic on the morning of the 9th November, when it became clear Donald Trump had won the election.)
With 38.2% retracements at B-C and D-E, the market (mostly!) gives the impression of orderly proceedings, backed by tests, or near tests of the closely watched gauge of annual health, the 200-day moving average.
The question of overbought momentum is less easy to sidestep, though the index’s incursion above the upper bound of its current rising channel looks more irrepressible than exhausted. Even here though, a rising wedge formed of the upper trend and a shorter-term line since 10th November would normally be expected to presage a break lower were it not theoretically misplaced in a rising trend.
A divergent Relative Strength Index (RSI), clear to the naked eye since 12th December, can be interpreted as momentum (or ‘sentiment’ or ‘conviction’) weakening, even as prices run higher. The market can of course continue to advance even when technically overbought and, as I write, the unwinding of the RSI from that state since mid-December can buy the rally more time.
The first sign that this time has run out might well be the triangle break out (as in break down) we mentioned earlier. Further confirmation would be its inability to capitalise on support implied by the impulsive up leg beginning around 19230, with better probability of more downside from a deeper retracement than 38.2%.
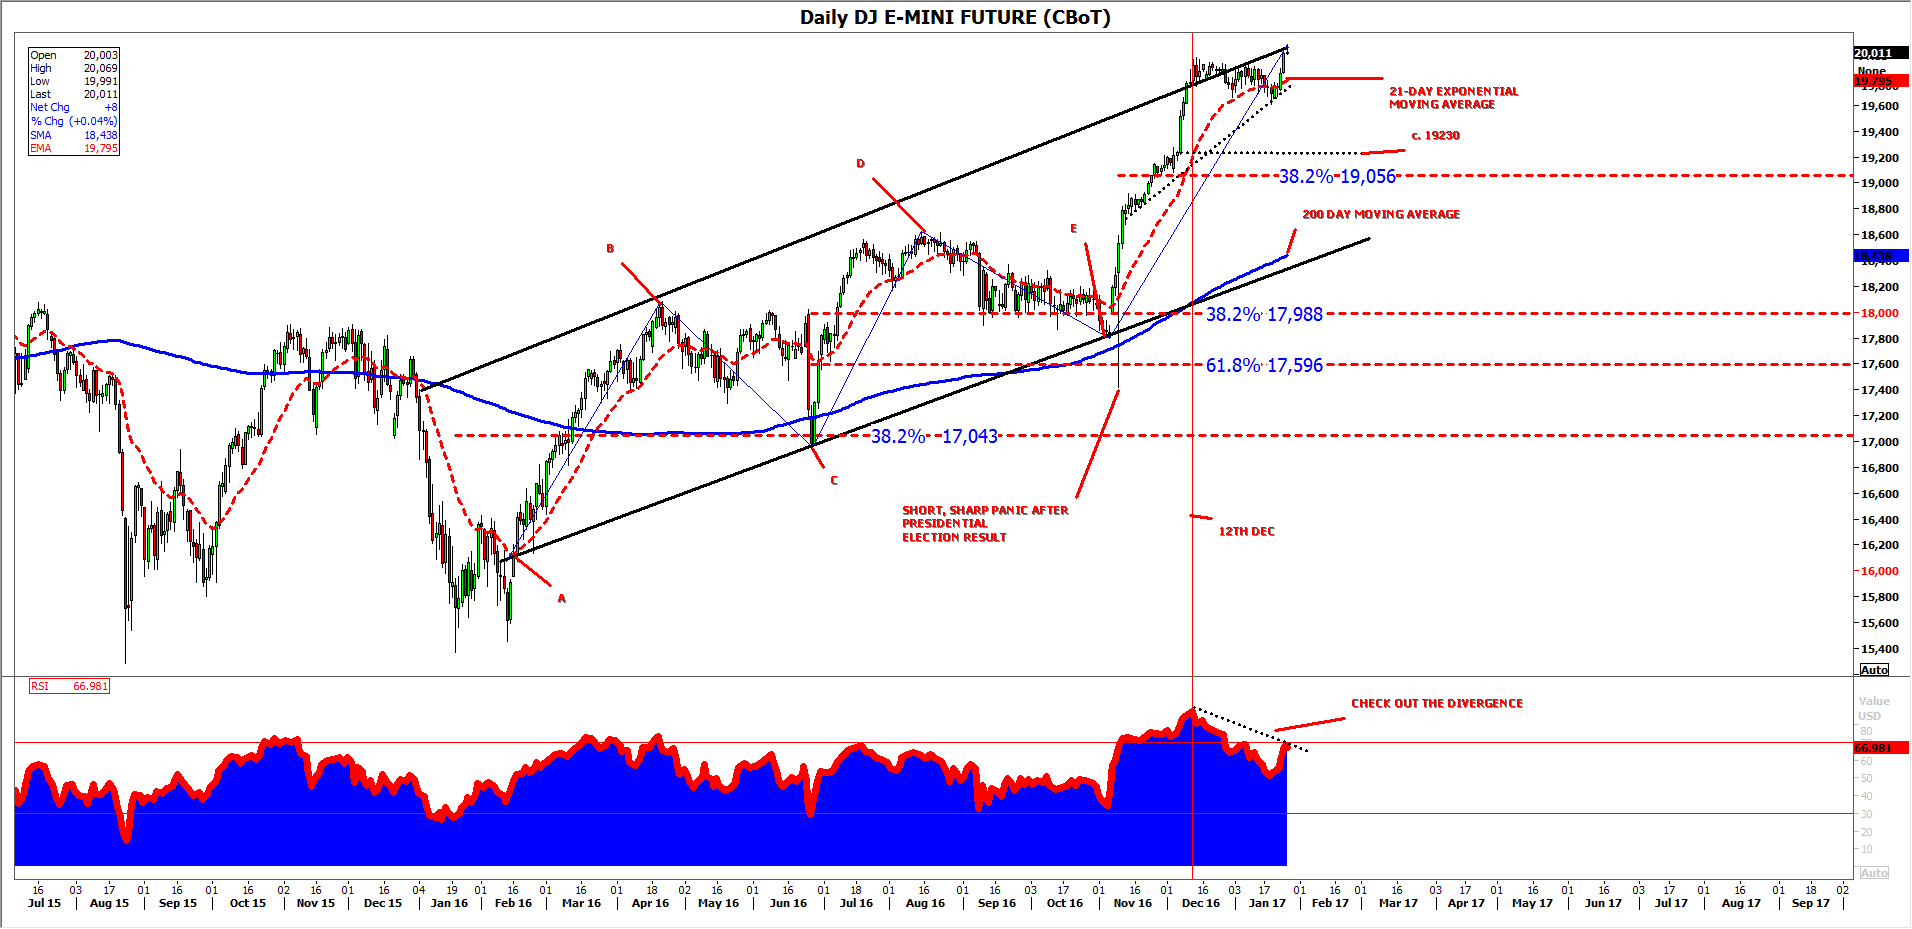
Please click image to enlarge; source: Thomson Reuters and City Index
