


Bank stocks are dominating the lower reaches of the FTSE on Tuesday. The likes of RBS, Lloyds, HSBC and Barclays have shed round 2% each despite the FTSE pushing higher.
The move lower comes as the UK’s largest banks face pressure to axe or at the very least delay their dividend pay outs. The move would ensure that the banks have sufficient resources to keep businesses afloat through the coronavirus crisis.
These banks are due to pay out around £15.3 billion in dividends, around half of it is due to be paid out in the coming weeks. This may not be prudent, given that these banks are also bracing themselves for a wave of bad loans from both businesses and individuals.
Bad loans
The government’s lock down of Britain has caused demand for goods and services to evaporate. Businesses are laying off staff to control costs. As a result, these individuals will struggle to pay back any loans they have.
Despite cutting costs and help from the government many businesses could struggle to survive. If they are not doing business the likelihood of the business failing, increases. No -one really knows how long the lock down will go on for. However, the three months floated by some senior medical advisers could prove to be too much of a strain for the UK high street.
Bankruptcies
The UK high street was already under strain prior to the coronavirs outbreak. One week into lock down and Carluccio’s and Brighthouse have collapsed. These are just the start of what promises to be a long list of companies failing. Bankruptcies could be a significant challenge for banks over the coming months.
The prospect of a dividend being cancelled has caused investors to jump ship into higher yielding investments, explaining today’s decline. Should the Bank of England implement the move for a freeze on bank dividend pay outs, Lloyds could be a particularly poor performer. Lloyds share price is already down 50% over the past 12 months.
Lloyds levels to watch
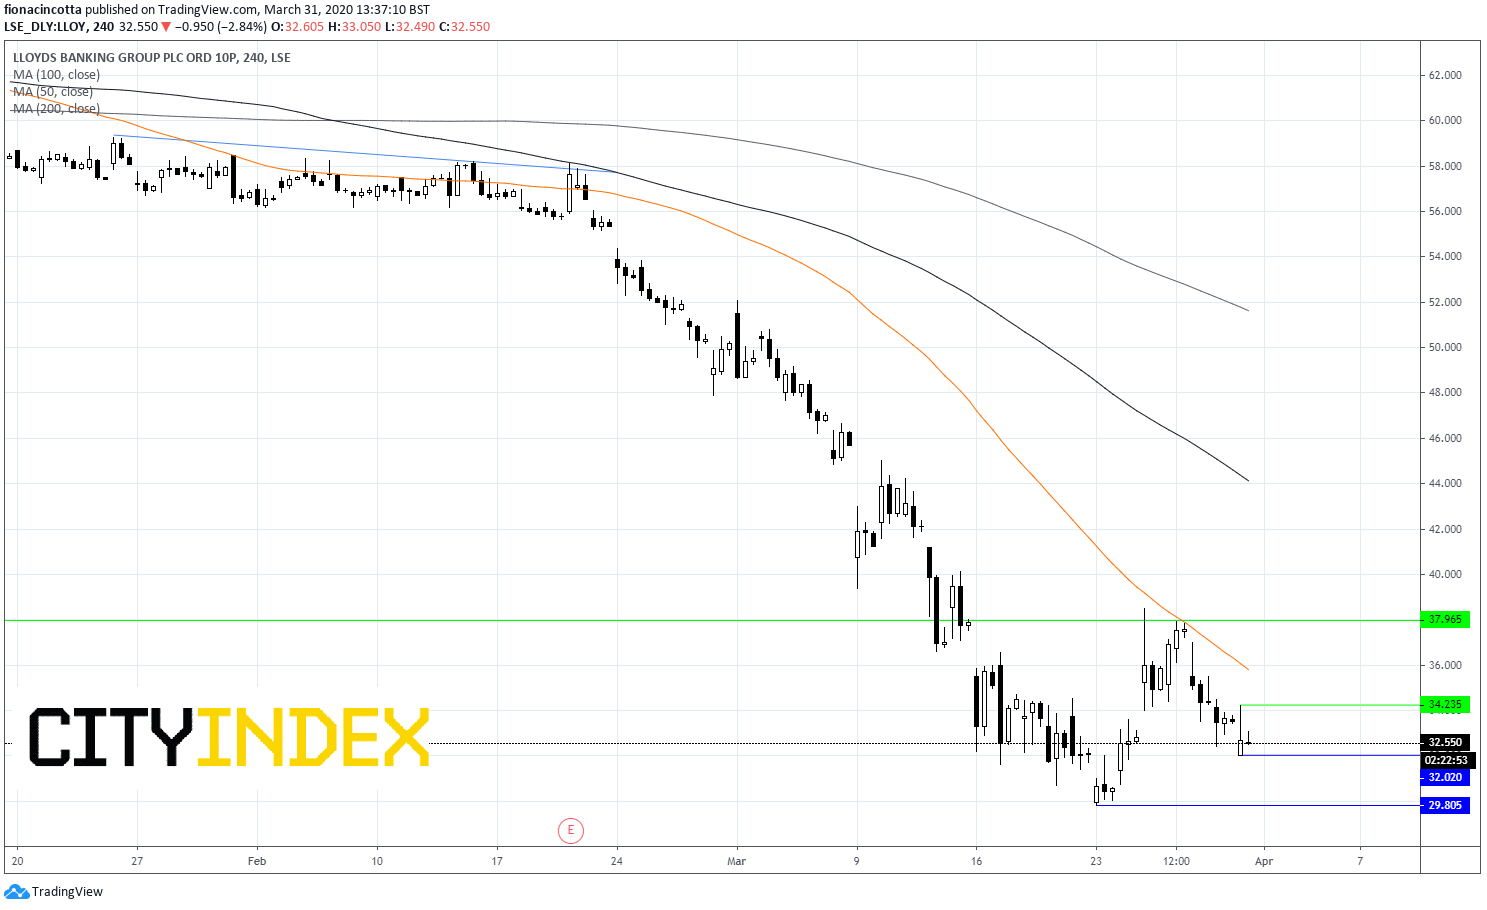
Lloyds trades below its 50, 100 and 200 sma on the 4 hour chart, a bearish chart. At the end of last week, the move higher was capped by the 50 sma at 38p. The path of least resistance is to the downside.
Resistance can be seen at 34.2 (today’s high) prior to 35.9 (50 sma).
Support is seen at 32p today’s low prior to 29.8p (low 23rd March)
Latest market news
Latest Bank Stocks articles
October 10, 2023 09:31 AM
October 6, 2023 02:28 PM
July 17, 2023 04:03 PM
July 11, 2023 02:28 PM