


September 9, 2019 6:15 PM
Who Said the Yield Curve is Inverted?
An inverted yield curve is said to be indicative of a recession. Why? Because the last 7 recessions were all preceded by an inverted yield curve. The yield curve we are referencing is the difference between the 10-year yield and the 2-year yield. Indeed, toward the end of August this yield curve did go briefly into negative territory for a few days. Does that mean a recession is ahead? Only time will tell. However, looking at today, we put in a bullish engulfing candle on a daily timeframe (in positive territory).
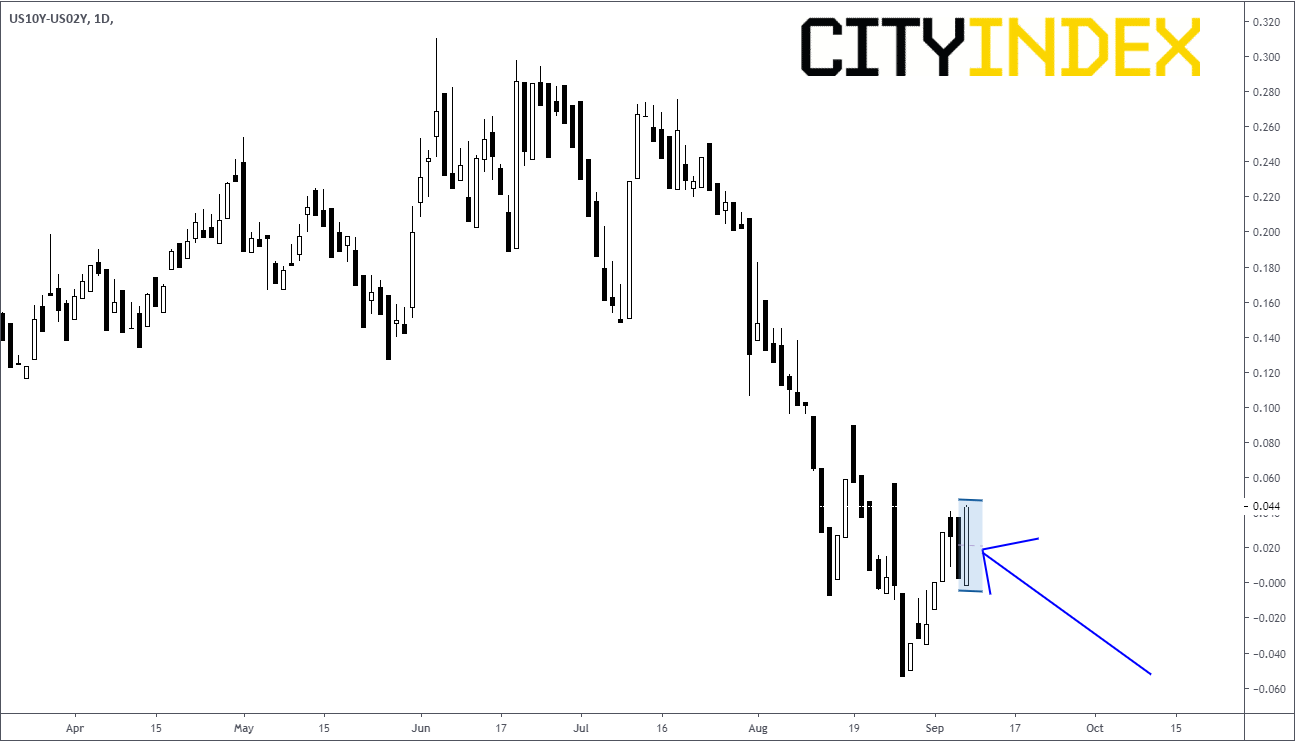
Source: Tradingview, City Index
The main reason for the bid was that the back end (longer term) bonds sold off at a faster rate than the front end (shorter term) bonds.
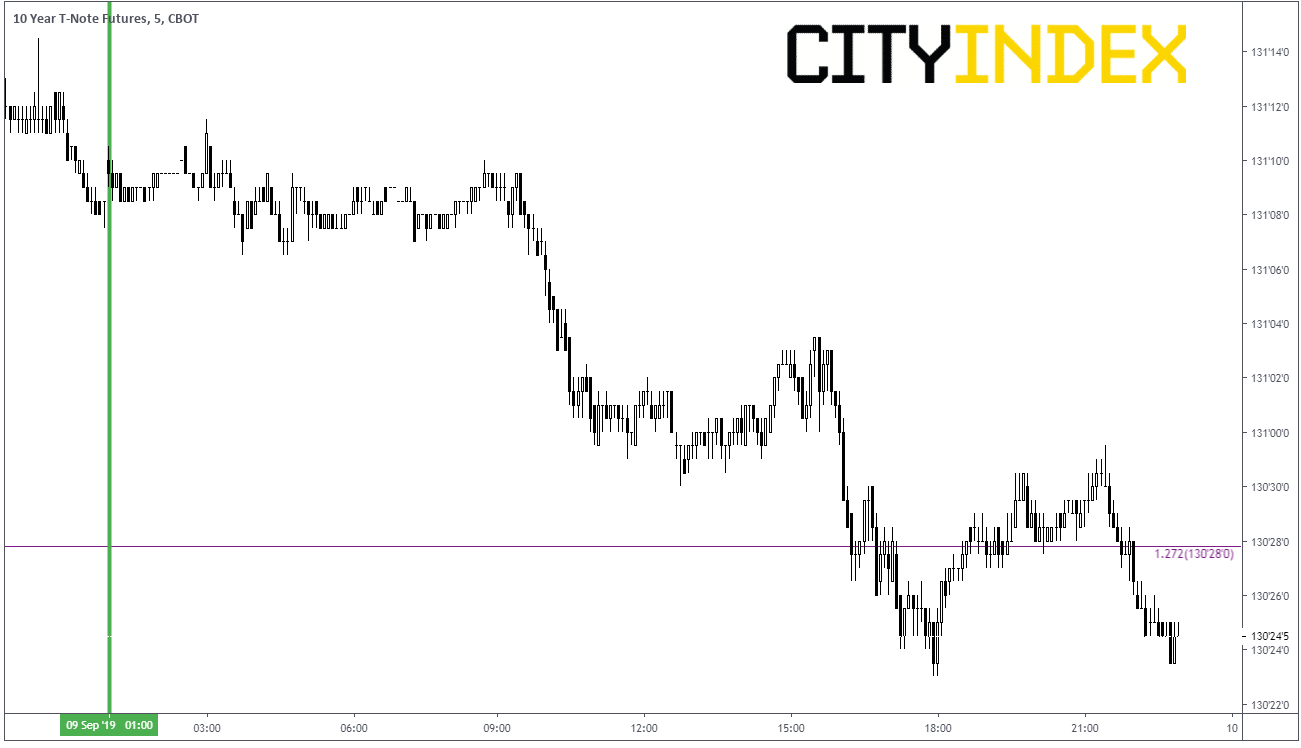
Source: Tradingview, City Index
Bonds and yields are inversely related. Therefore, yields rose faster in the back end than in the front end causing the yield curve to rise.
Will the yield curve turn negative again soon? Obviously, there is no way to tell, but let’s look at another instrument with a similar pattern and see what happened:
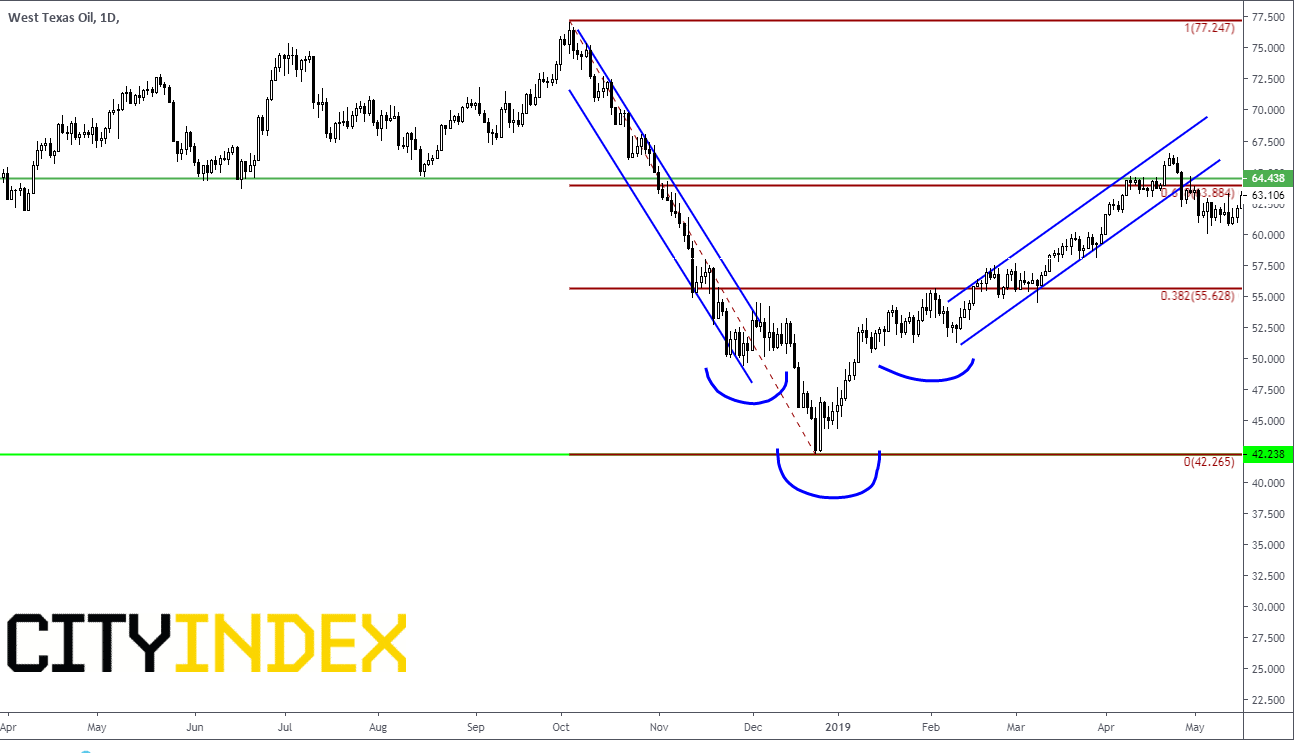
Source: Tradingview, City Index
Fall of 2018, WTI Crude Oil
- Traded lower in a channel from near $77.50 to near $55.00
- Put in a head and shoulders REVERSAL bottom down to $42.23
- Stalled at the neckline of the 32.8% retracement of the entire move lower, near $55.00
- Broke the neckline at roughly $55.00.
- Traded higher within a channel to the 61.8% retracement of the previous move, and horizontal resistance, near $64.00.
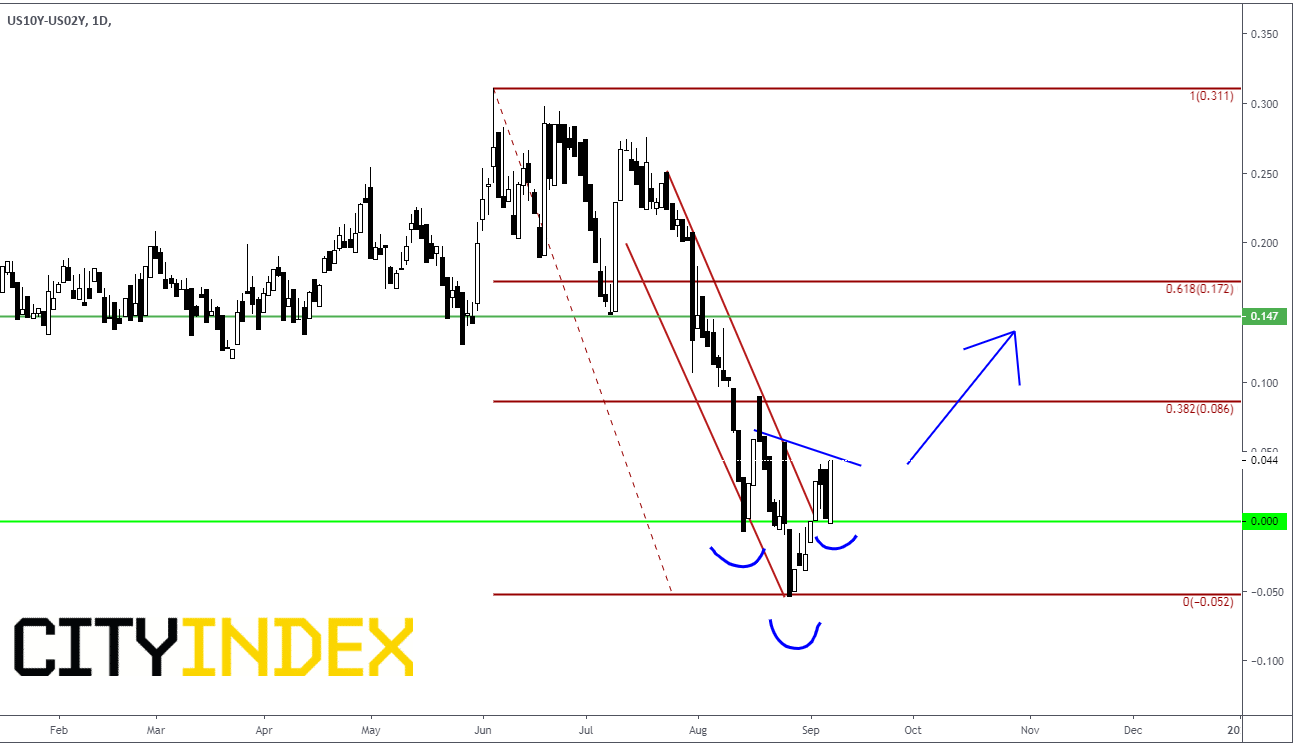
Source: Tradingview, City Index
Summer of 2019, Yield Curve
- Traded lower in a channel from near 0.25 down to 0.00
- Currently putting in the right shoulder of a possible head and shoulders REVERSAL bottom down near -0.05.
- Stalling at neckline at 0.041%
- Bidding up towards the 38.2% retracement level of the entire move lower, near 0.086.
- If the 38.2% retracement level gets taken out, the yield curve could bid up to the 61.8% retracement of the previous move, and horizontal resistance, near 0.15/0.17
Could the current yield curve follow the same pattern as crude did in the fall of 2018? Maybe. But planning a trade and being ready for the possible outcomes are just as important as executing the trade!
Latest market news
Today 11:14 AM
Today 08:28 AM
Yesterday 03:30 PM
Latest Bonds articles
April 23, 2024 11:09 PM
April 22, 2024 03:42 AM
April 18, 2024 06:20 AM
April 10, 2024 01:09 AM