


April 9, 2020 2:50 AM
As regular readers would know, like other market analysts we often give ourselves a “pat on the back” when our market calls work out as planned. It is therefore only fair that we acknowledge when key calls don’t work out as well.
In late February, after global stock markets had begun to unwind in response to the emerging threat of the coronavirus, we wrote again about the benefits that Bitcoin offered to traders as a safe haven asset.
“In the meantime it's more about weathering the storm. In this light, Bitcoin is catching the eye as other safe-haven assets such as gold are caught in the cross asset position wash.”
The technical picture at the time appeared to support our bullish Bitcoin macro view, although final confirmation on the charts was still lacking.
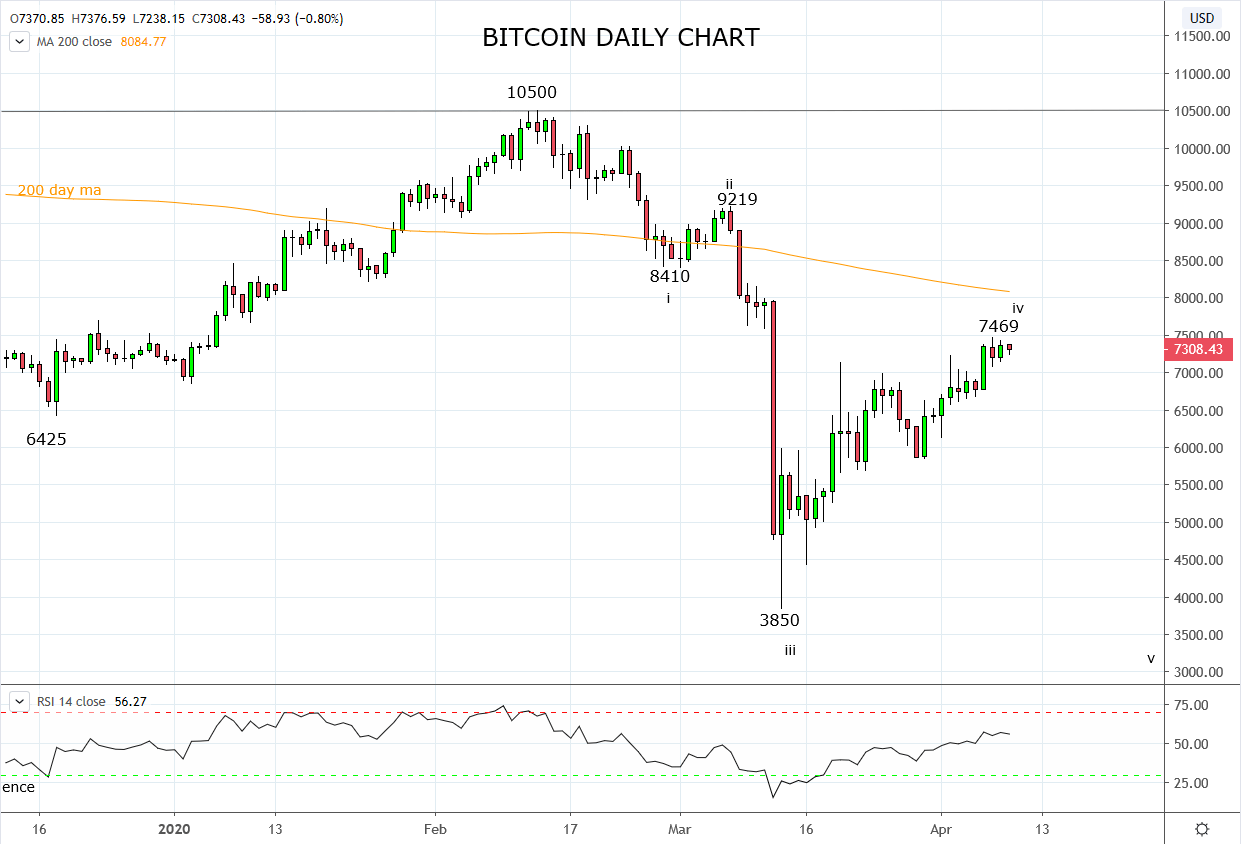
“to confirm the uptrend has resumed and as the catalyst to open longs, a break/daily close above the resistance 9000/9200 area is needed.”
A daily close above 9200 failed to materialize, although the price did get close enough to encourage eager buyers like myself into the trade, before Bitcoin was caught in the same vicious broad-based liquidation that struck risk assets and safe havens alike.
Since reaching a low near 3850, Bitcoin has mounted a recovery of sorts and while the macro picture has only strengthened following the unprecedented amount of monetary easing announced by central banks and governments in March, the technical picture implies Bitcoin is not yet out of the woods.
The decline from the 10500 February high took on distinctly impulsive characteristics in March and the rally from the 3850 low appears to be part of a corrective Wave iv. This suggests once the current rally is over, another leg lower, below 3850 is needed to complete a five-wave decline.
Because I remain fundamentally a Bitcoin bull, I am not interested in taking a short trade using the set up above. Instead, I am looking for levels that Bitcoin needs to break above to negate the downside risks mentioned above. In that sense, a break and two consecutive daily closes back above the 200-day moving average 8100 area would be a good start. However, to confirm a medium-term low is in place at 8350 and that the uptrend has resumed, a break and close above horizontal resistance and year to date highs at 10500 is required.
Source Tradingview. The figures stated areas of the 9th of April 2020. Past performance is not a reliable indicator of future performance. This report does not contain and is not to be taken as containing any financial product advice or financial product recommendation
Latest market news
Today 05:45 AM
Yesterday 11:09 PM
Yesterday 11:01 PM
Yesterday 04:00 PM
Yesterday 01:15 PM
Latest Bitcoin USD articles
Today 05:45 AM
April 15, 2024 07:13 PM
April 9, 2024 01:15 AM
March 21, 2024 11:48 PM