


April 28, 2021 11:53 AM
What to watch post-FOMC
As on most FOMC days, the overnight sessions are quiet. And although not much is expected from today’s meeting, there may be one or two small changes in the statement or the press conference. Fed Chairman Powell has gone through great lengths to ensure that expectations are known that the Fed will assume highly accommodative monetary policy until we are past the pandemic. (See our complete FOMC Preview here). However, there are always instruments to keep an eye on just in case Powell decides to surprise the markets.
Everything you need to know about the Federal Reserve
Gold
Gold (XAU/USD) had been moving lower in an orderly channel since August 2020. After reached the bottom trendline of the channel in early March, the precious metal tested the level once again near 1678 and formed a double bottom. After breaking the neckline on April 15th, the pair moved towards its double bottom target of 1830. However, last week, Gold ran into resistance at the top trendline of the channel near 1755.
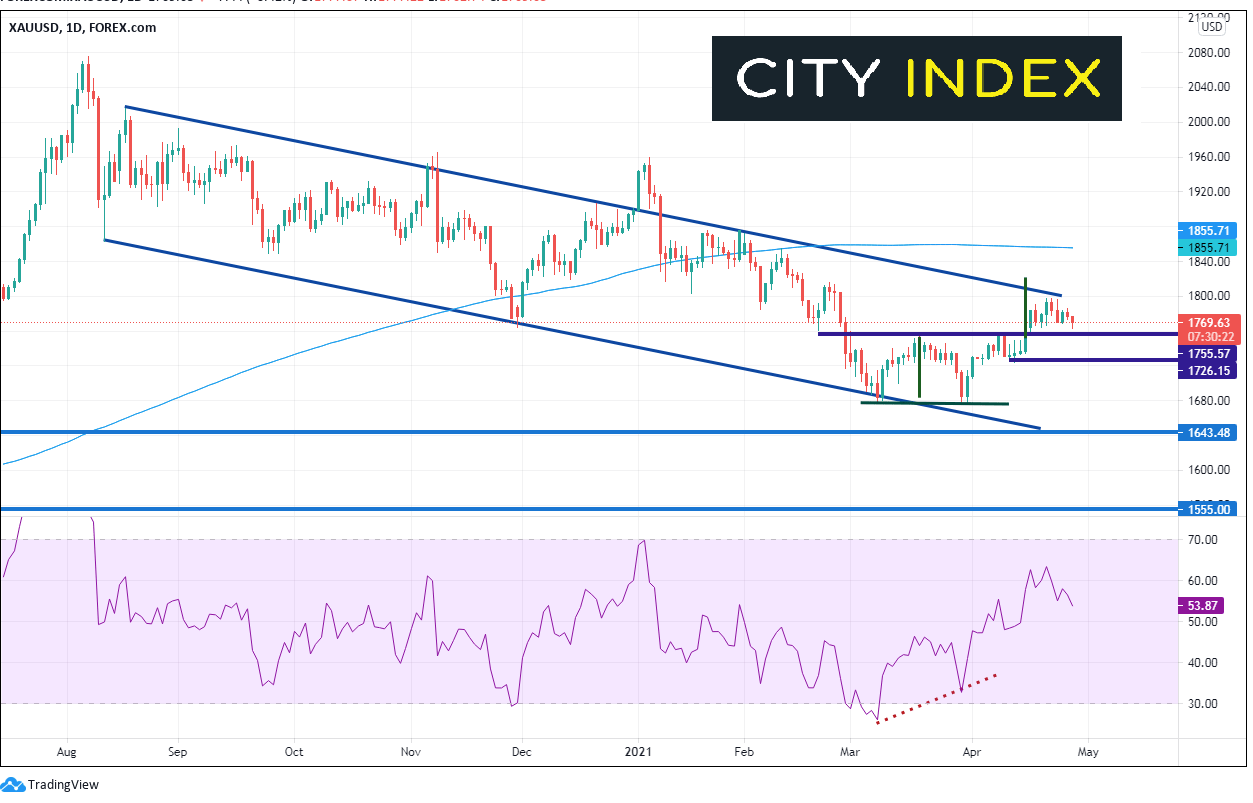
Source: Tradingview, City Index
On a 240-minute timeframe, Gold moved higher within a channel to the 38.2% Fibonacci retracement level from the early January highs to the March double bottom lows, just below 1800. Currently, it has pulled back below the bottom trendline of the channel (most likely on profit taking ahead of the Fed). Support is at the neckline breakout of the double bottom near 1755, then horizontal support near 1724 ahead of the double bottom lows at 1722. Resistance above is at the confluence of the previous highs and the trendline near 1798 and then the 50% retracement level from the previously mentioned timeframe near 1820.
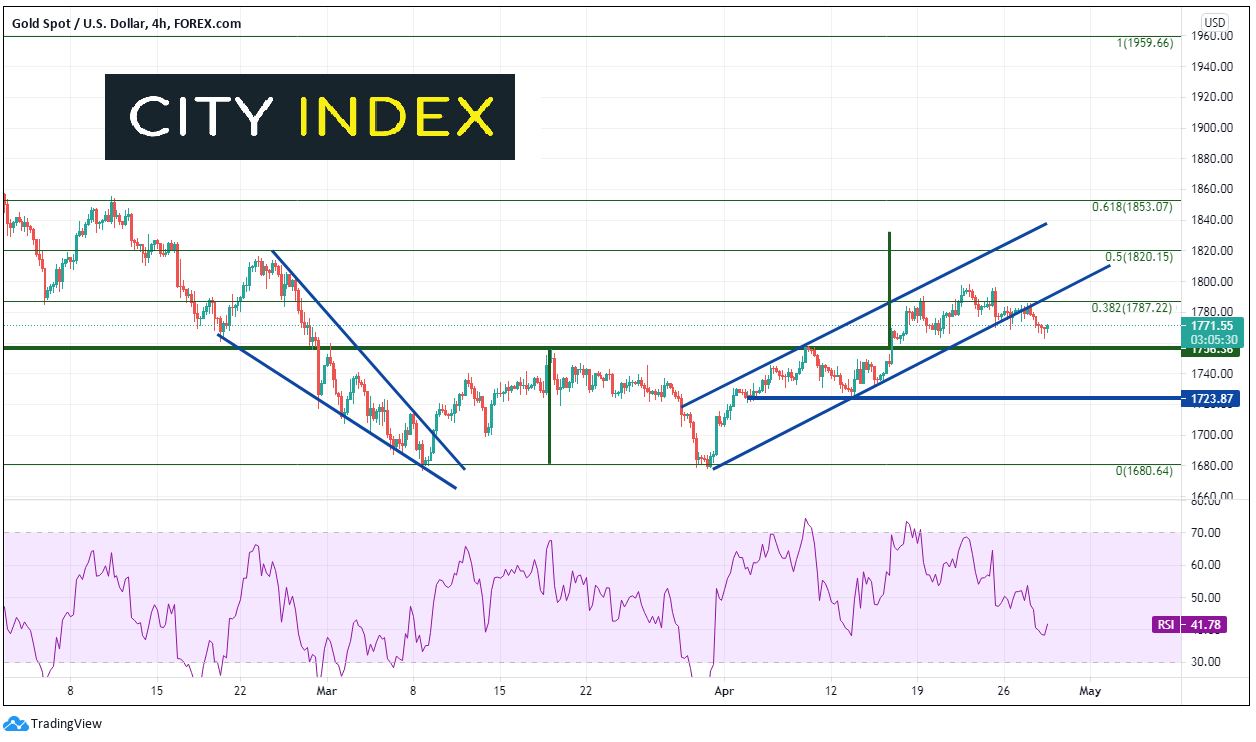
Source: Tradingview, City Index
Learn How to start gold trading
US 10-Year Yields
Yields could also move post-FOMC. 10-year yields had recently formed a head a shoulders pattern and have come back to test the neckline for a second time, as well as horizontal resistance from the right shoulder is near 1.65. Any hawkish speak from the FOMC statement or Powell in the press conference could cause a clear break above the neckline and cause a failure of the pattern. Resistance is at the right shoulder highs near 1.70 and then the top of the head near 1.762. Support below is at the recent lows of 1.53, followed by the March 11th lows of 1.475. The target for the head and shoulders pattern is below there at 1.435.
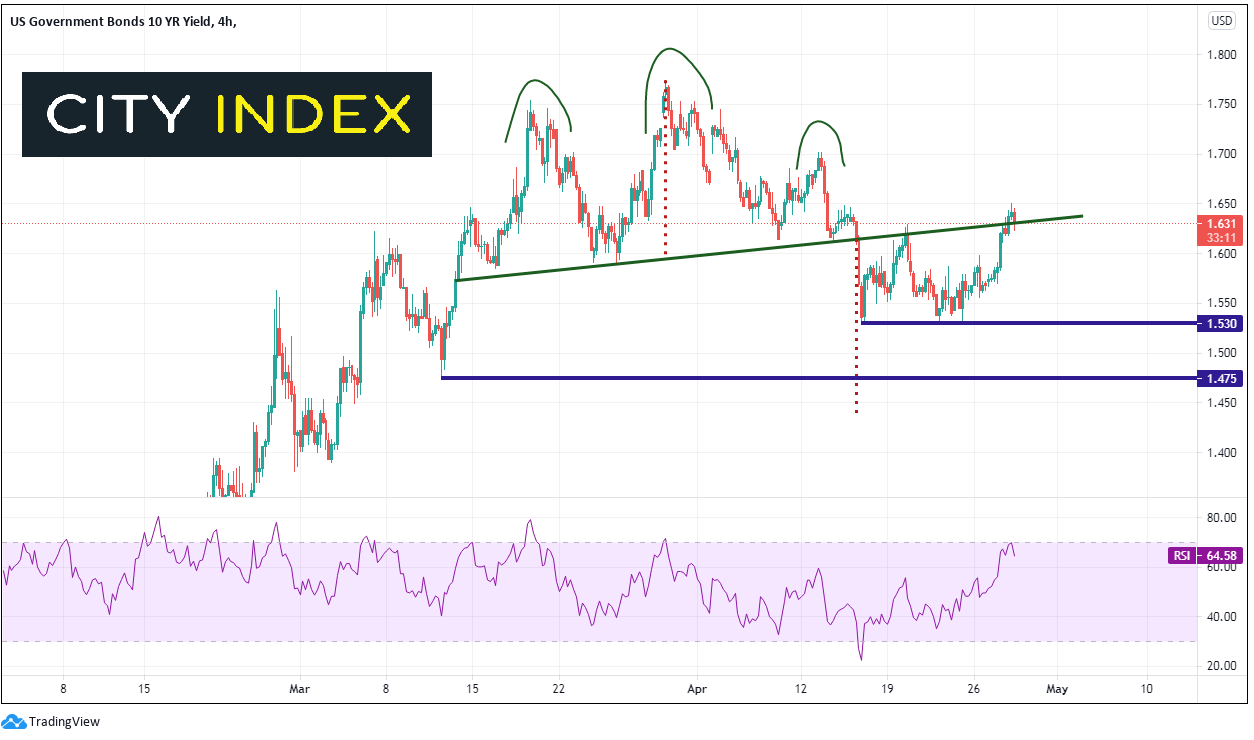
Source: Tradingview, City Index
DXY
Of course, the US Dollar is always important to watch when looking at interest rates. The US Dollar Index (DXY) has been moving lower since putting in quarter end and month end highs on March 31st. Could this be the moment the index reverses and continues moving higher? On a 240-minute timeframe the DXY has formed a descending wedge and is nearing the apex. Any hawkish talk from the Fed could send the index higher. Resistance is at the overnight highs and the top downward sloping trendline of the wedge near 91.10. Above there is recent highs and horizontal resistance near 91.40 and then the 38.2% Fibonacci retracement level from the March 31st highs to the April 26th lows near 91.73. Support is at the April 26th lows near 90.66, then the bottom trendline of the wedge near 90.55. The psychological round number support is at 90.00.
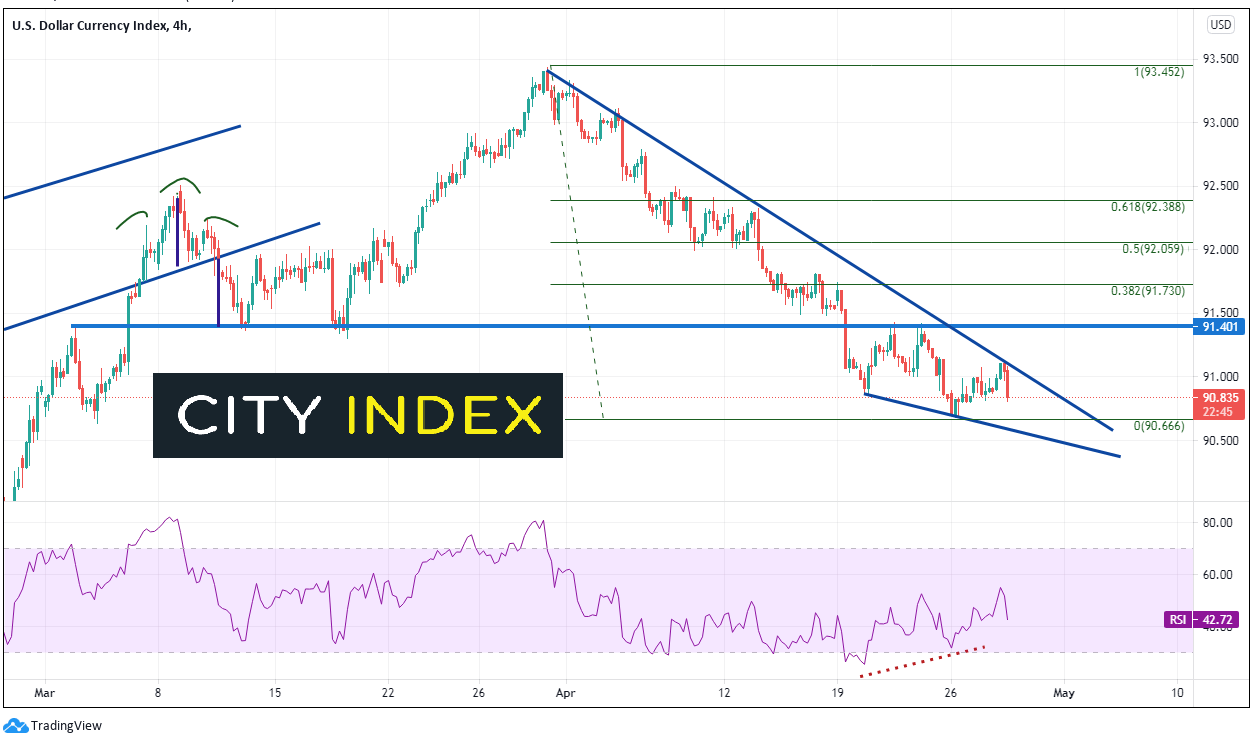
Source: Tradingview, City Index
Expectations are for an unchanged FOMC. Traders will be watching for tweaks in the statement and ANY hints regarding timing of the tapering at the press conference. Be alert for any surprises and note inflection points BEFORE the meeting!
Learn more about forex trading opportunities.
Latest market news
Today 08:33 AM
Yesterday 11:48 PM
Yesterday 11:16 PM
Latest Gold articles
April 1, 2024 01:09 PM
March 28, 2024 10:30 AM
March 26, 2024 11:24 PM
March 26, 2024 12:00 PM