


Amazon
The stock reports as it is trading more than 60% higher YTD boosted by its e-commerce strength and its AWS cloud platform. Costs will once again be under the spotlight in Q2 earnings, particularly after Jeff Bezos said that he was less focused on near term profits, instead prioritizing improving the customer experience. Earnings come at a time when investors are starting to rotate out of stay at home stocks into value stocks, with Amazon dropping -7% last week. Expectations are for EPS $1.63 on revenue of $63.40 billion.
The stock reports as it is trading more than 60% higher YTD boosted by its e-commerce strength and its AWS cloud platform. Costs will once again be under the spotlight in Q2 earnings, particularly after Jeff Bezos said that he was less focused on near term profits, instead prioritizing improving the customer experience. Earnings come at a time when investors are starting to rotate out of stay at home stocks into value stocks, with Amazon dropping -7% last week. Expectations are for EPS $1.63 on revenue of $63.40 billion.
Chart thoughts
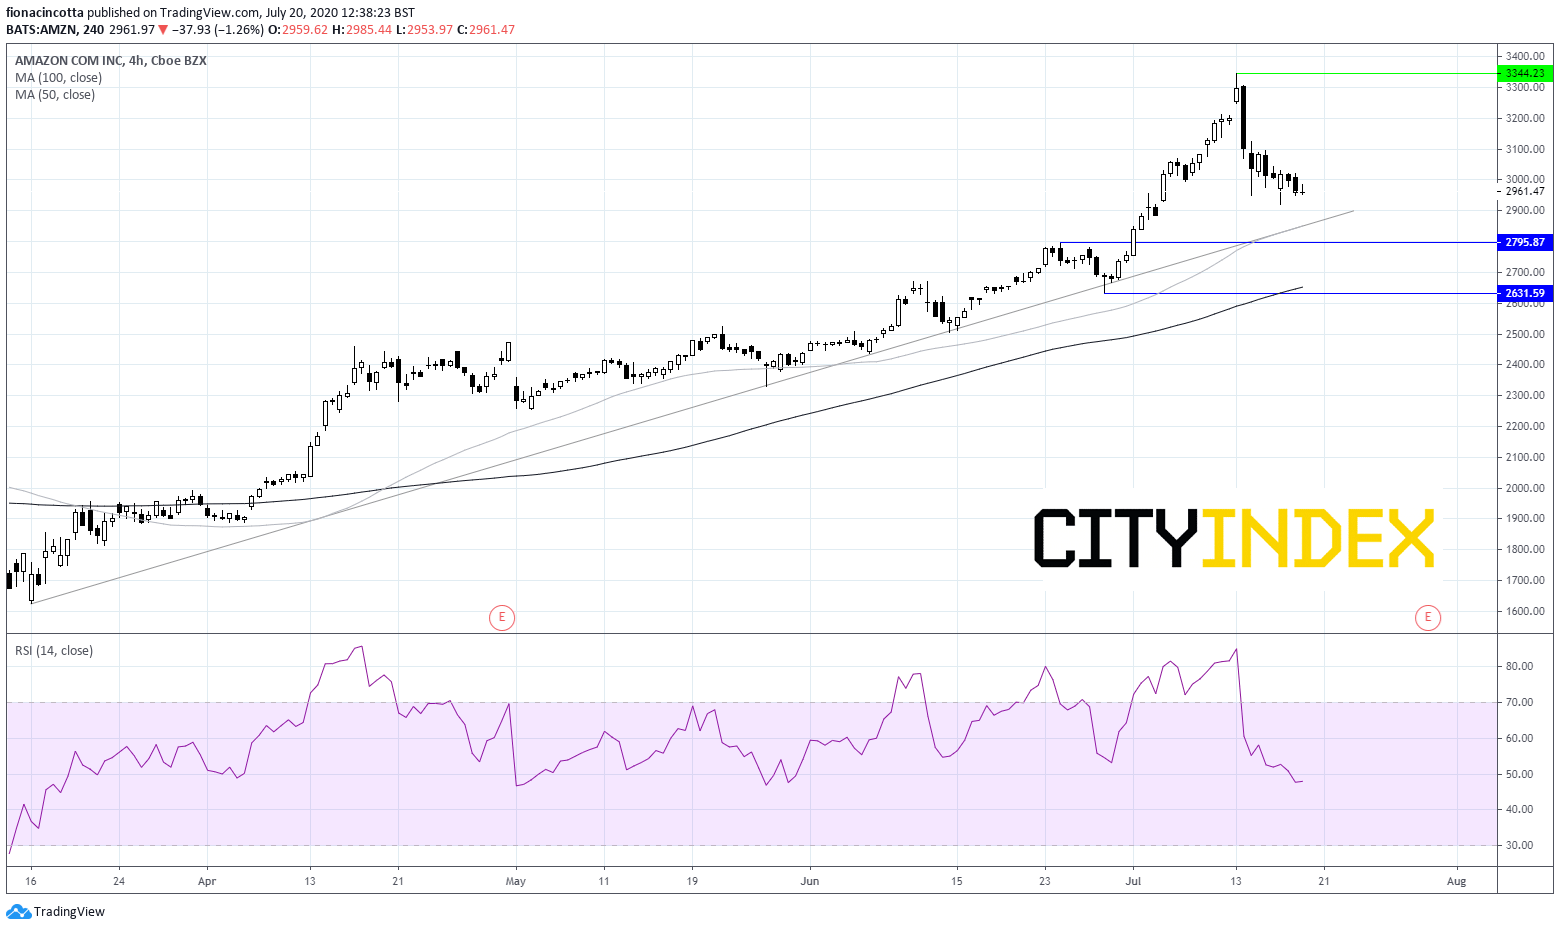
Whilst Amazon might have dropped sharply across the previous week, the stock remains above its 50, 100 and 200 daily moving averages and above its ascending trendline. The sell off did however, bring the stock out of overbought territory, so more buying could still be on the cards
Immediate resistance would be at the key psychological $3000 mark, prior to the all-time high of $3344.
On the flip side, immediate resistance from the ascending trendline can be seen around the $2850 level, prior to support at $2800 and around $2630.
Twitter
Twitter’s share price was under pressure at the end of last week in the wake of an historic security breach which poses a serious and potentially long-term risk for the social media company. The breach adds an extra layer of costs to ensure there isn’t a repeat scenario. Over the longer term, it raises concerns over the safety of other users and data. An erosion of trust could well manifest itself in weaker investor sentiment and a lower share price. Twitter is up 9% YTD the weakest performer among its peers. Expectations EPS -$0.03 on revenue $697.56 million.
Chart thoughts
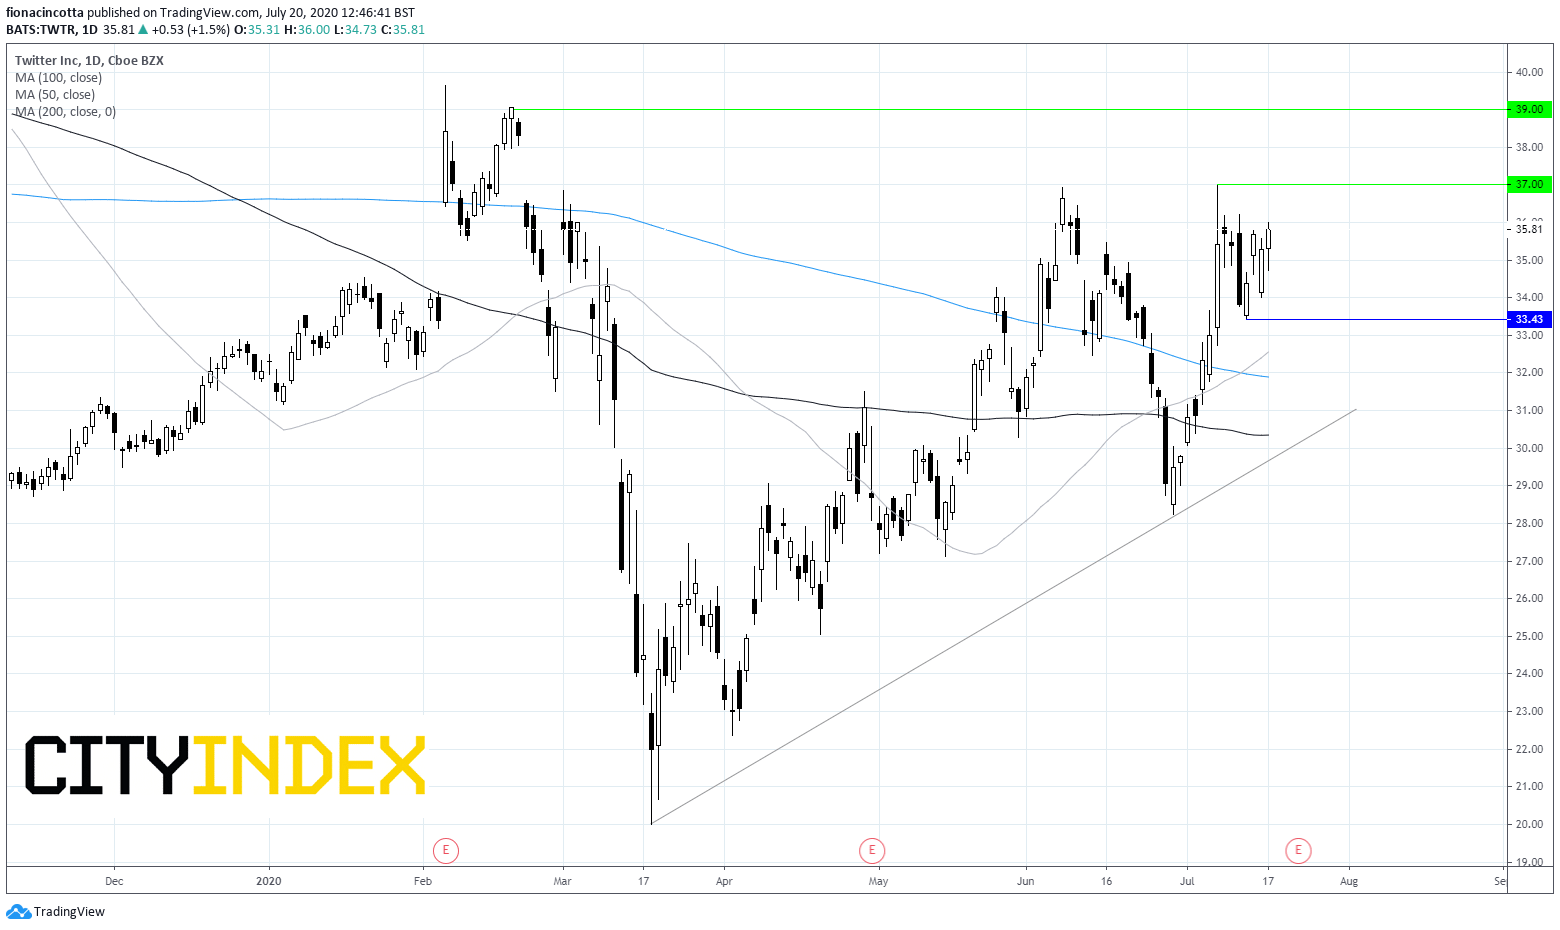
Despite no trading as bullishly as its peers, Twitter remains above its 50,100 and 200 daily moving average and above its ascending trendline on a bullish chart which could indicate more upside is on the cards.
Immediate resistance can be seen at $37 (high July 8th) prior to $39 (high 20th February).
On the down side, immediate support can be seen at 33.40 (low 14th July) prior to the 50 daily moving average at $32.50 and the 200 sma at $31.90
Latest market news
Latest Tech Stocks articles
October 19, 2023 09:47 AM
October 18, 2023 12:06 PM
October 11, 2023 02:41 PM
October 3, 2023 12:24 PM