


May 14, 2021 12:08 PM
What is pushing USD/CAD lower?
Since the Bank of Canada met on April 21st , when they cut bond purchases from C$4 billion/week to C$3 billion/week, USD/CAD has been in a freefall. Price has dropped from 1.2654 on that date to a low of 1.2046 on May 12th. Is it solely because the BOC has begun tapering, or are their other factors involved? And can it continue to move lower?
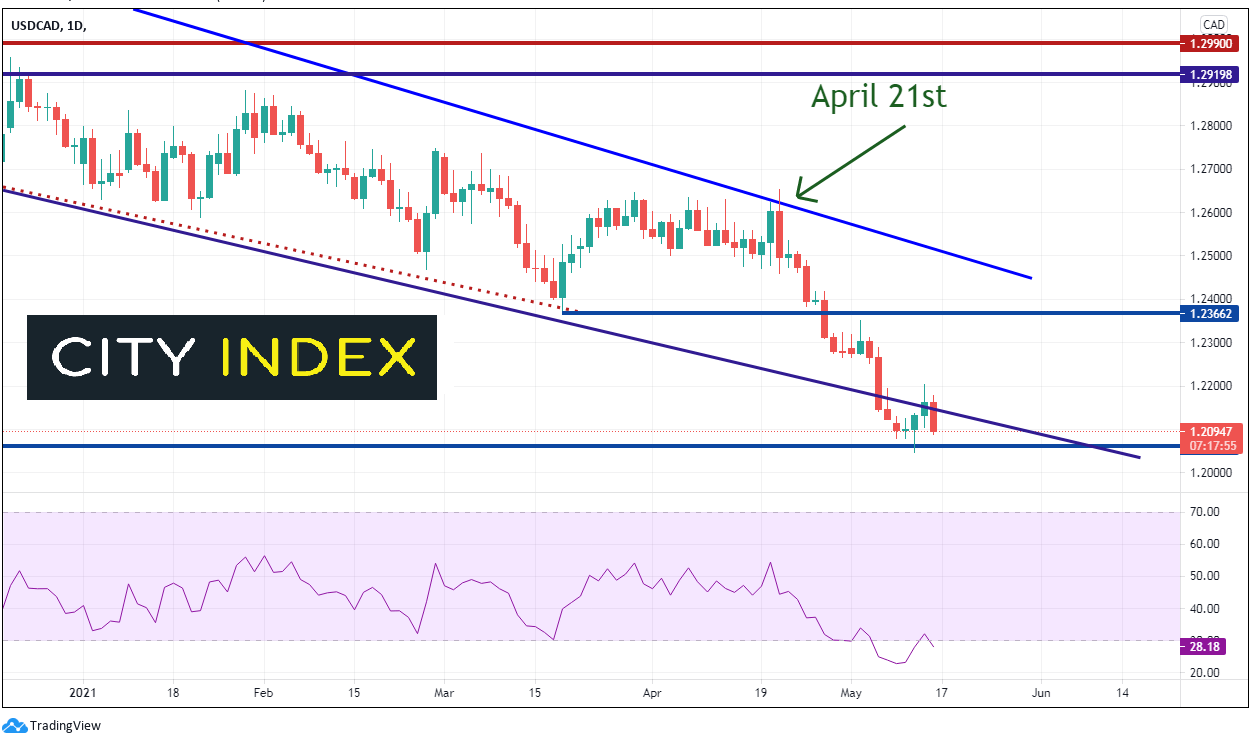
Source: Tradingview, City Index
Economic Data
The data released since then, in both the US and Canada, has been less than stellar to say the least. However, the same data that has been released for both countries was worse for the US. Both Canadian and US employment were horrible for April, however the US data missed expectations by much more, with only 266,000 jobs created vs 980,000 expected. US Manufacturing data for April was worse than expected, as was Canada’s Ivey PMI. And by the way, US Retail Sales released today were worse than expected too. (Canada’s doesn’t release retail sales for April until late June.) This would back the Fed’s view that stimulus is still needed. However, both CPI and PPI for the US came in hot, while Canada releases April CPI data this week. This tells a different story. Prices are rising; however, the US Fed says that inflation is transitory. Therefore, worse US data and transitory inflation (so they say). Stagflation? This means possibly more US stimulus and a lower US Dollar, and therefore, a lower USD/CAD.
Crude Oil
As an oil export led country, the value of the Canadian Dollar is heavily influenced by the price of Crude oil. On the bottom of the chart below shows the correlation coefficient of Crude Oil Futures and USD/CAD. For the most part, the correlation has been negative since the beginning of the year. This means that as the price of Crude Oil increases so does the Canadian Dollar. Therefore, when Crude Oil rises, USD/CAD falls. In addition, the correlation has become more and more negative since the end of April. The current reading is -0.78. A reading of -1.00 means that Crude Oil and USD/CAD are perfectly negatively correlated and move together 100% of the time. A reading of -0.77 is a strong negative correlation.
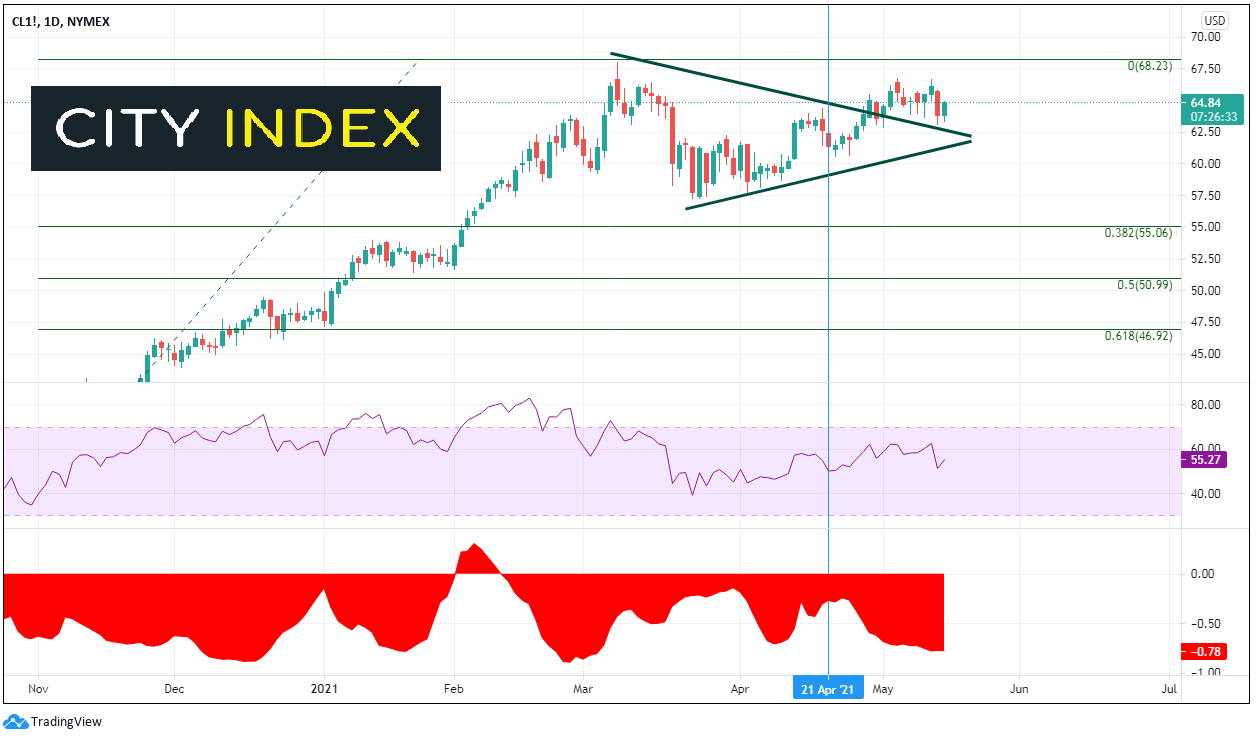
Source: Tradingview, City Index
What factors move the price of oil?
Crude Oil has been moving higher since its pandemic lows in April 2020. On March 8th, crude oil put in a high of 67.98 and formed a symmetrical triangle. On May 3rd, it broke higher out of the triangle and on May 13th, pulled back to retest the upper trendline up the triangle (as USD/CAD moved higher). Today Crude is moving higher once again (as USD/CAD moves lower). If crude oil moves above the May 5th resistance highs of 66.76, it is free to test the March 8th highs of 67.98. Support is at the triangle trendline near 62.75.
In the shorter-term……
On a 240-minute timeframe, USD/CAD has been moving in a downward sloping channel since the highs of April 21st. After a false breakout below the bottom trendline, price moved back inside the channel. As is often the case, when price fails on one side of a pattern, price often tests the opposite side. Yesterday, price formed as shooting start reversal candle as it tested the downward sloping, top trendline of the channel, as well as horizontal resistance near 1.2200. Support is at the May 12th lows, which is also lows from September 2017, near 1.2049, then the psychological round number support near 1.2000. Below there are the May 2015 lows at 1.1917. Resistance above is at the top trendline of the short-term channel, which also confluences with a downward sloping trendline of a wedge on the daily timeframe, near 1.2150/75. Above there are yesterday’s highs near 1.2200 and then horizontal resistance at 1.2260.
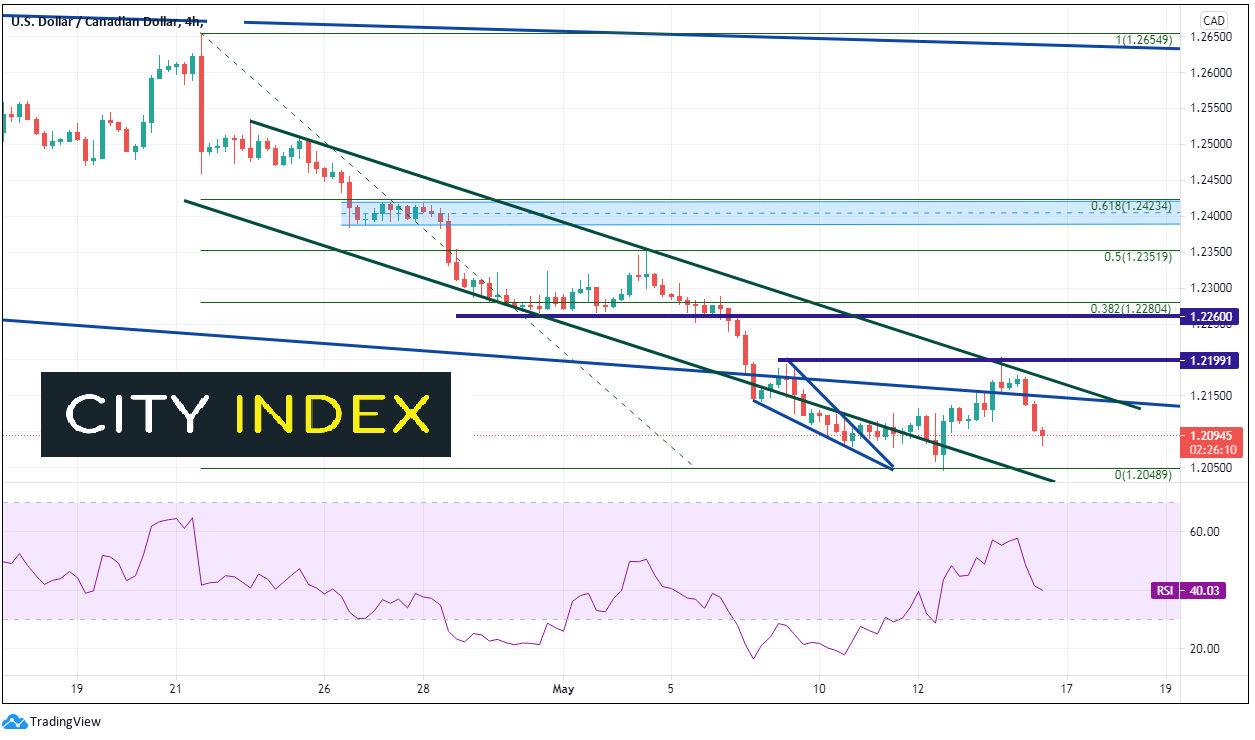
Source: Tradingveiw, City Index
USD/CAD has been moving lower since the beginning of the pandemic. However, the selloff picked up in earnest after the BOC announced tapering on April 21st. With the worse than expected economic data for April thus far, as well as, no sign of help from the Fed to help lift the US Dollar, USD/CAD could continue moving lower. And if Crude Oil breaks higher, that could be the dagger in the heart for the pair, which could soon be below 1.2000. However, if the Fed gives any signs of tapering, the move lower could reverse quickly.
Learn more about forex trading opportunities.
Latest market news
Yesterday 01:23 PM
Yesterday 06:01 AM
April 18, 2024 11:27 PM
April 18, 2024 04:46 PM
Latest CAD articles
March 23, 2023 07:33 PM
March 13, 2023 02:54 PM
February 21, 2023 02:21 PM
February 17, 2023 04:05 PM