


S&P 500 – Bounced off from 2940 key support
click to enlarge charts
Key Levels (1 to 3 weeks)
Pivot (key support): 2940
Resistances: 2988, 3028 (all-time high) & 3055/70
Next support: 2850
Directional Bias (1 to 3 weeks)
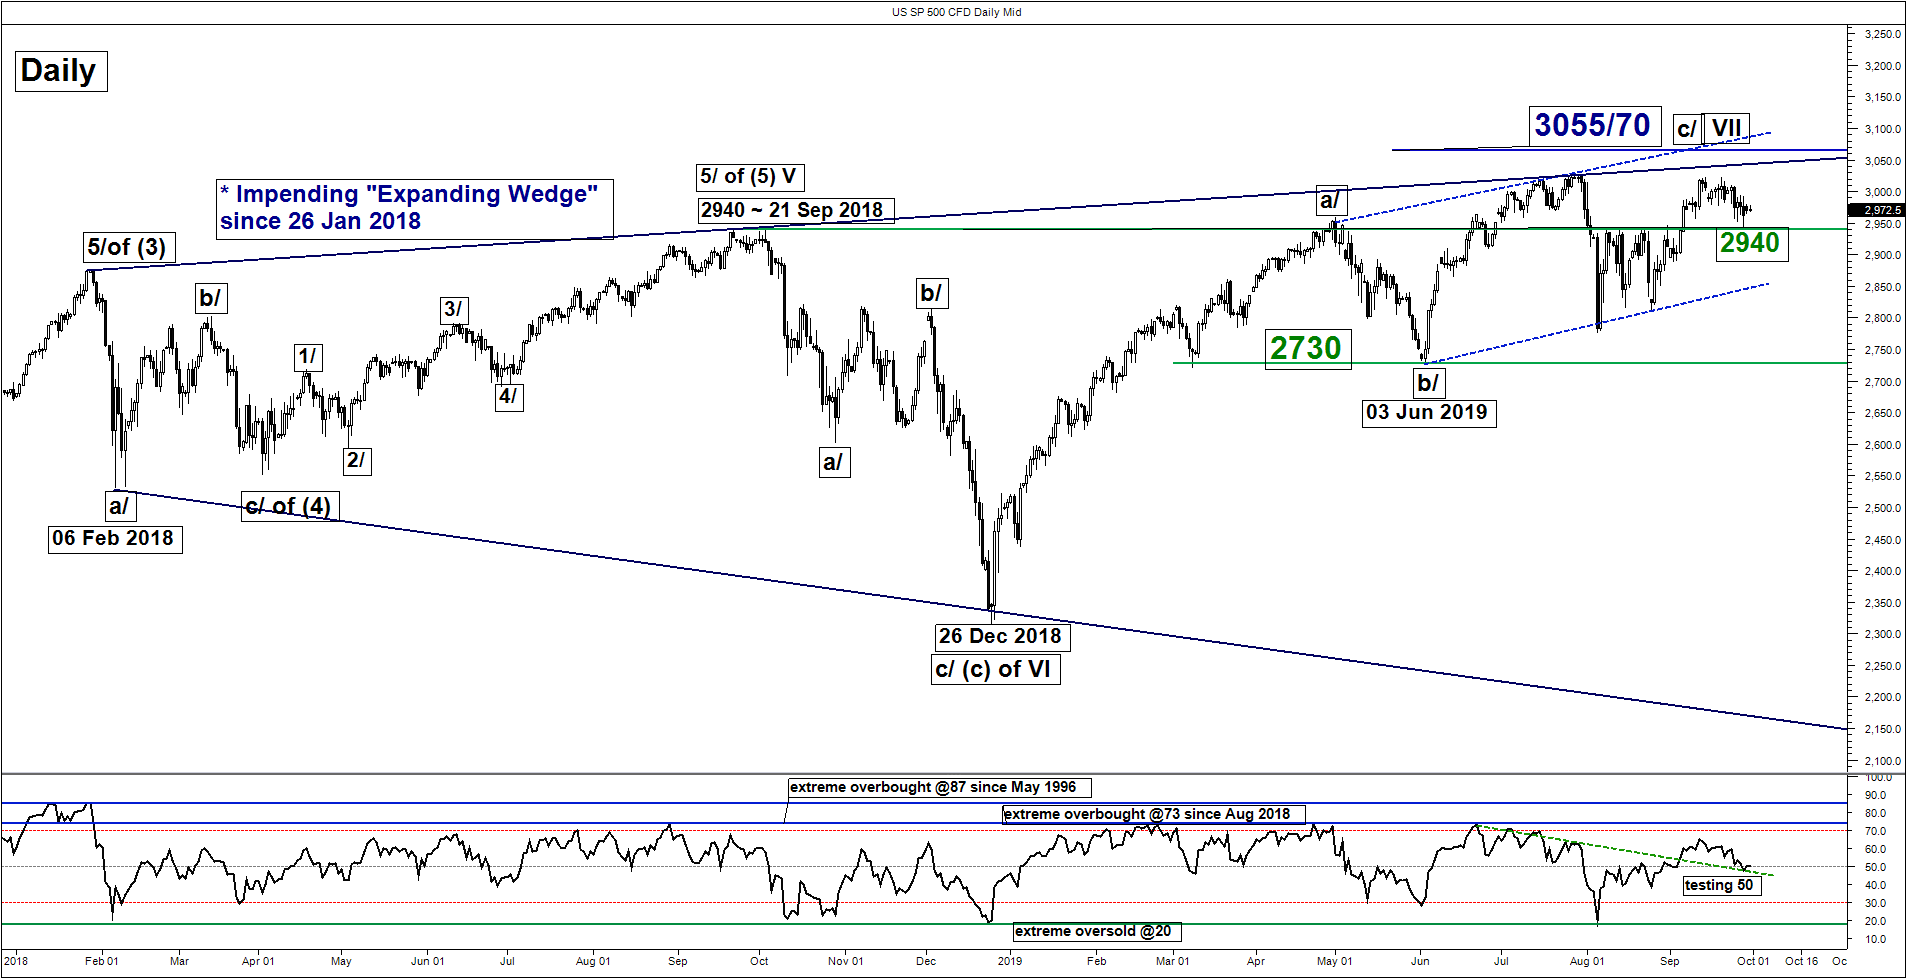
The SP 500 Index (proxy for the S&P 500 futures) had made an attempt to break above its current all-time high level of 3028 on 19 Sep (printed an intraday high of 3022) before it tumbled by -2.4% to print a low of 2944 seen on last Fri, 28 Sep.
Last week’s decline seen in the Index had been accompanied by a string of negative news flow; the U.S. House of Representatives had opened an impeachment inquiry on President Trump and the U.S. administration is considering ways to limit U.S. investors’ portfolio inflows into China ahead of a high-level trade negotiation talk between U.S. and China officials to be held next week in Washington.
Interestingly, the Index has managed to hold right above the predefined 2940 key medium-term pivotal support as per highlighted in our previous report (click here for a recap) despite the negative news flow with positive technical elements.
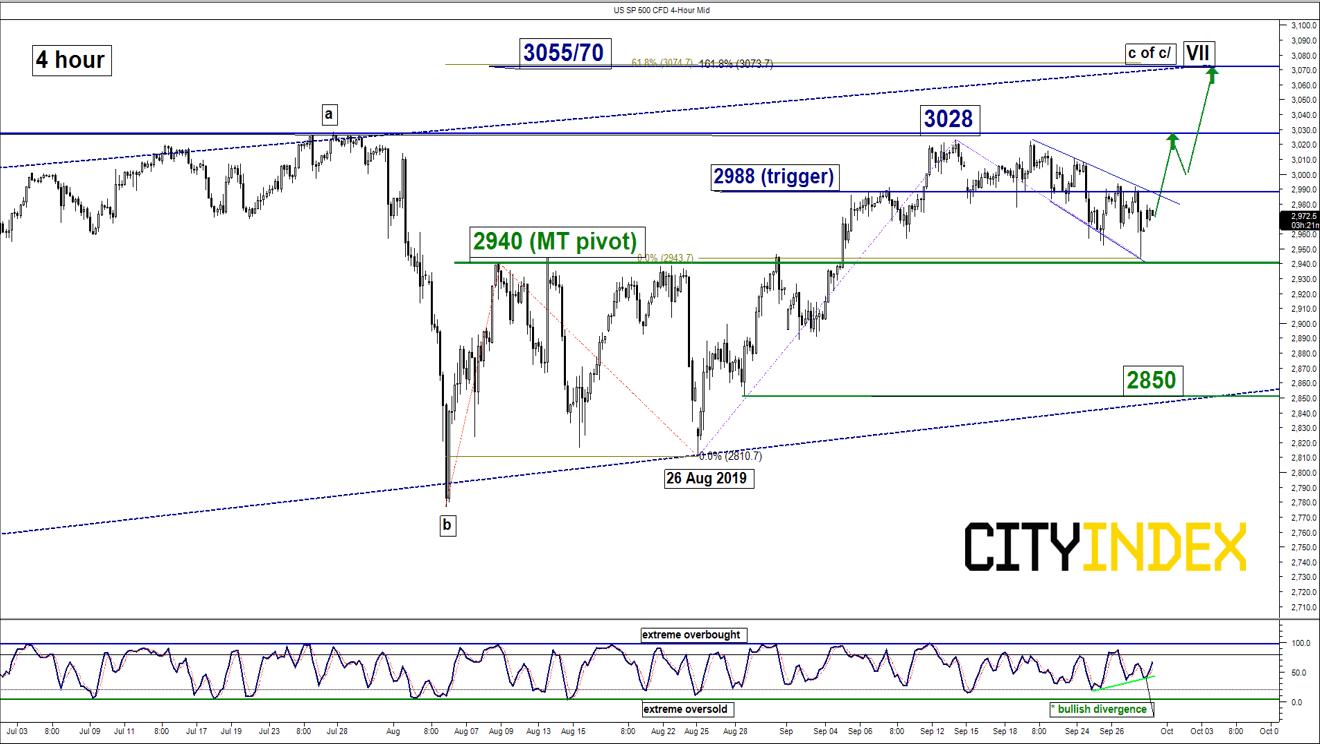
Maintain bullish bias with 2940 remains as the key medium-term pivotal support and added 2988 as the upside trigger level for a potential residual push up to retest 3028 before target the significant key resistance/risk zone of 3055/70. On the other hand, a daily close below 2940 invalidates the bullish scenario for another round of choppy decline towards the next support at 2850 (lower boundary of an ascending range since 03 Jun 2019).
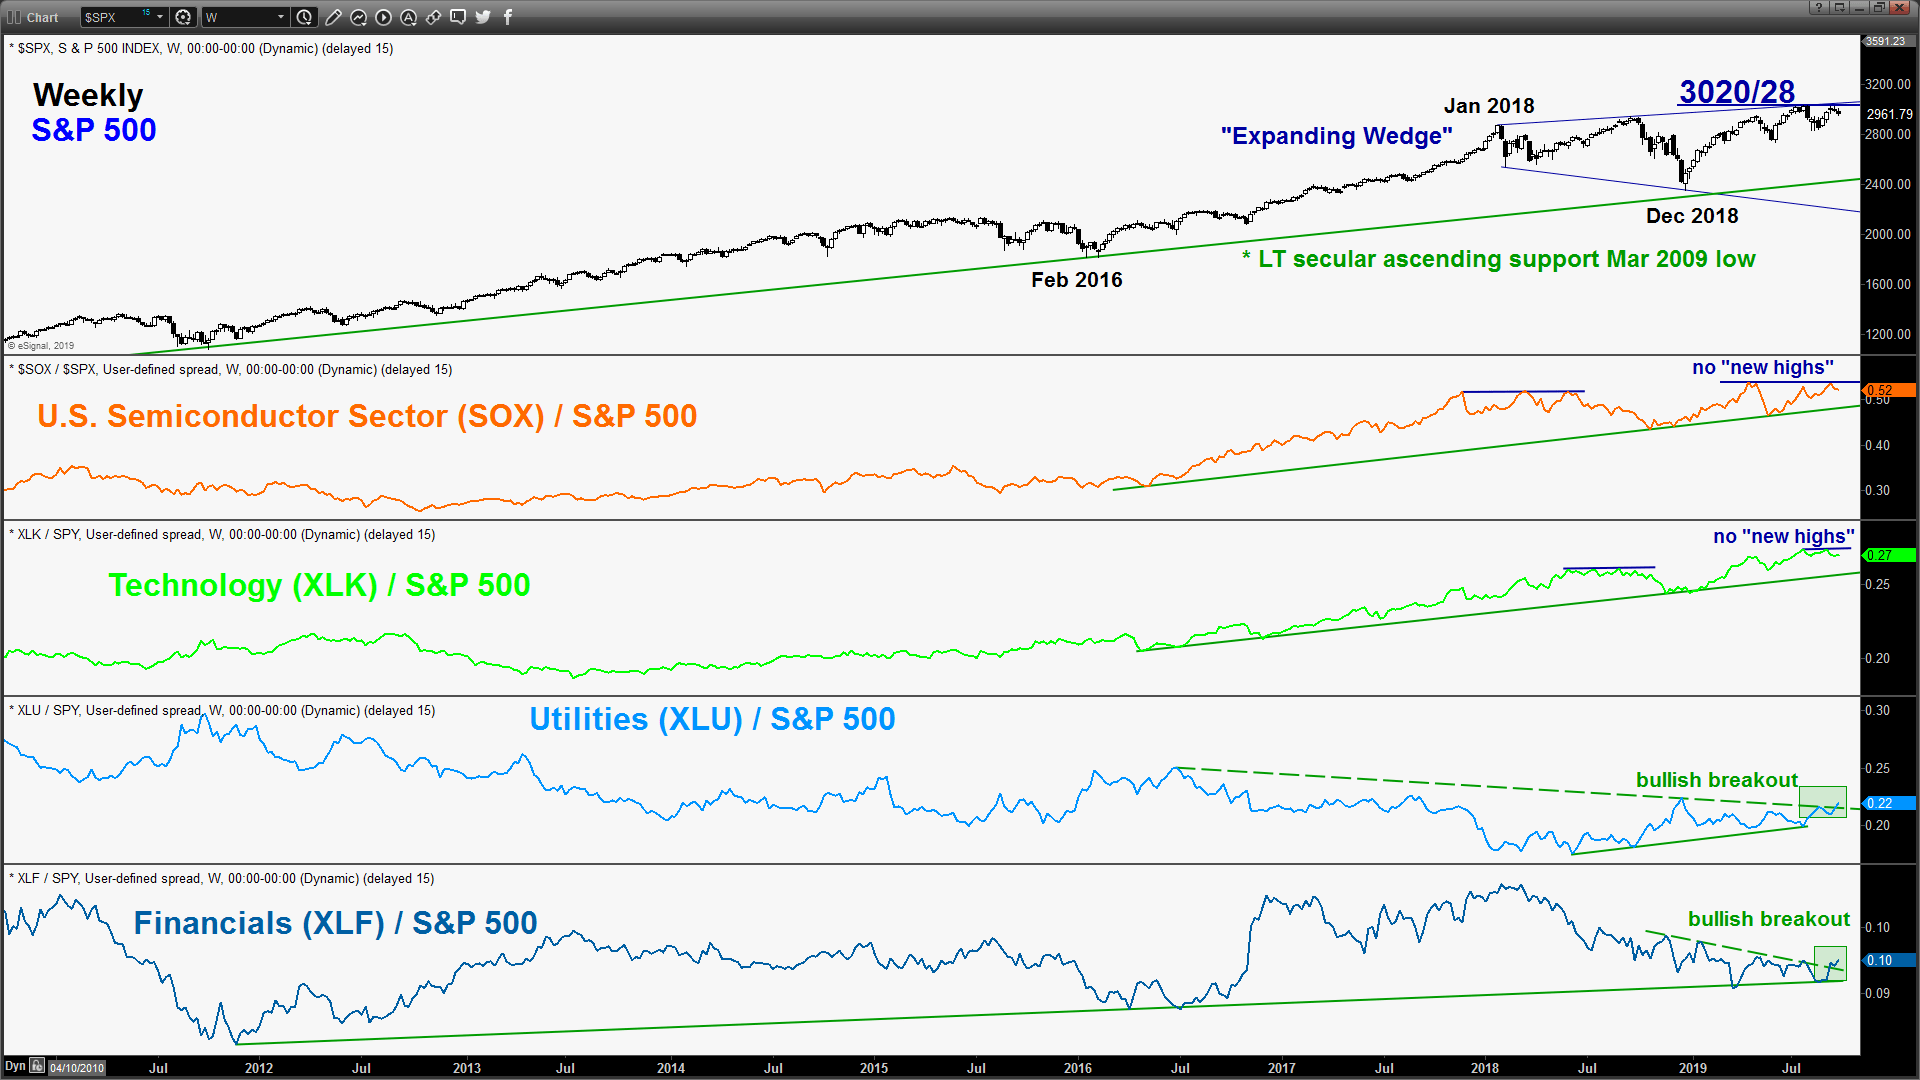
- Relative strength analysis between several key U.S. sectors suggest that there is a significant positive shift towards more “defensives oriented” and “value oriented” sectors over the higher beta Semiconductor and Technology sectors. The ratios of Utilities (XLU – defensive) and Financials (XLF – value) over the S&P 500 has staged a significant bullish breakout. These observations suggest that these sectors can assist to maintain the medium-term bullish trend of the Index.
- The daily RSI oscillator has managed to hold at a significant corresponding support at the 50 level with a bullish divergence signal seen in the shorter-term 4-hour Stochastic oscillator at its oversold region. These observations suggest that the recent downside momentum in price action has started to ease.
- The 2.4% decline from its 19 Sep high of 3022 has taken the form of a “Descending Expanding Wedge” configuration which tends to be a bullish continuation pattern. The upper boundary of the pattern stands at 2988.
Nikkei 225 – 21680 key support to watch
click to enlarge charts
Key Levels (1 to 3 weeks)
Pivot (key support): 21680
Resistances: 22150 & 22490
Next supports: 21300 & 20820
Directional Bias (1 to 3 weeks)
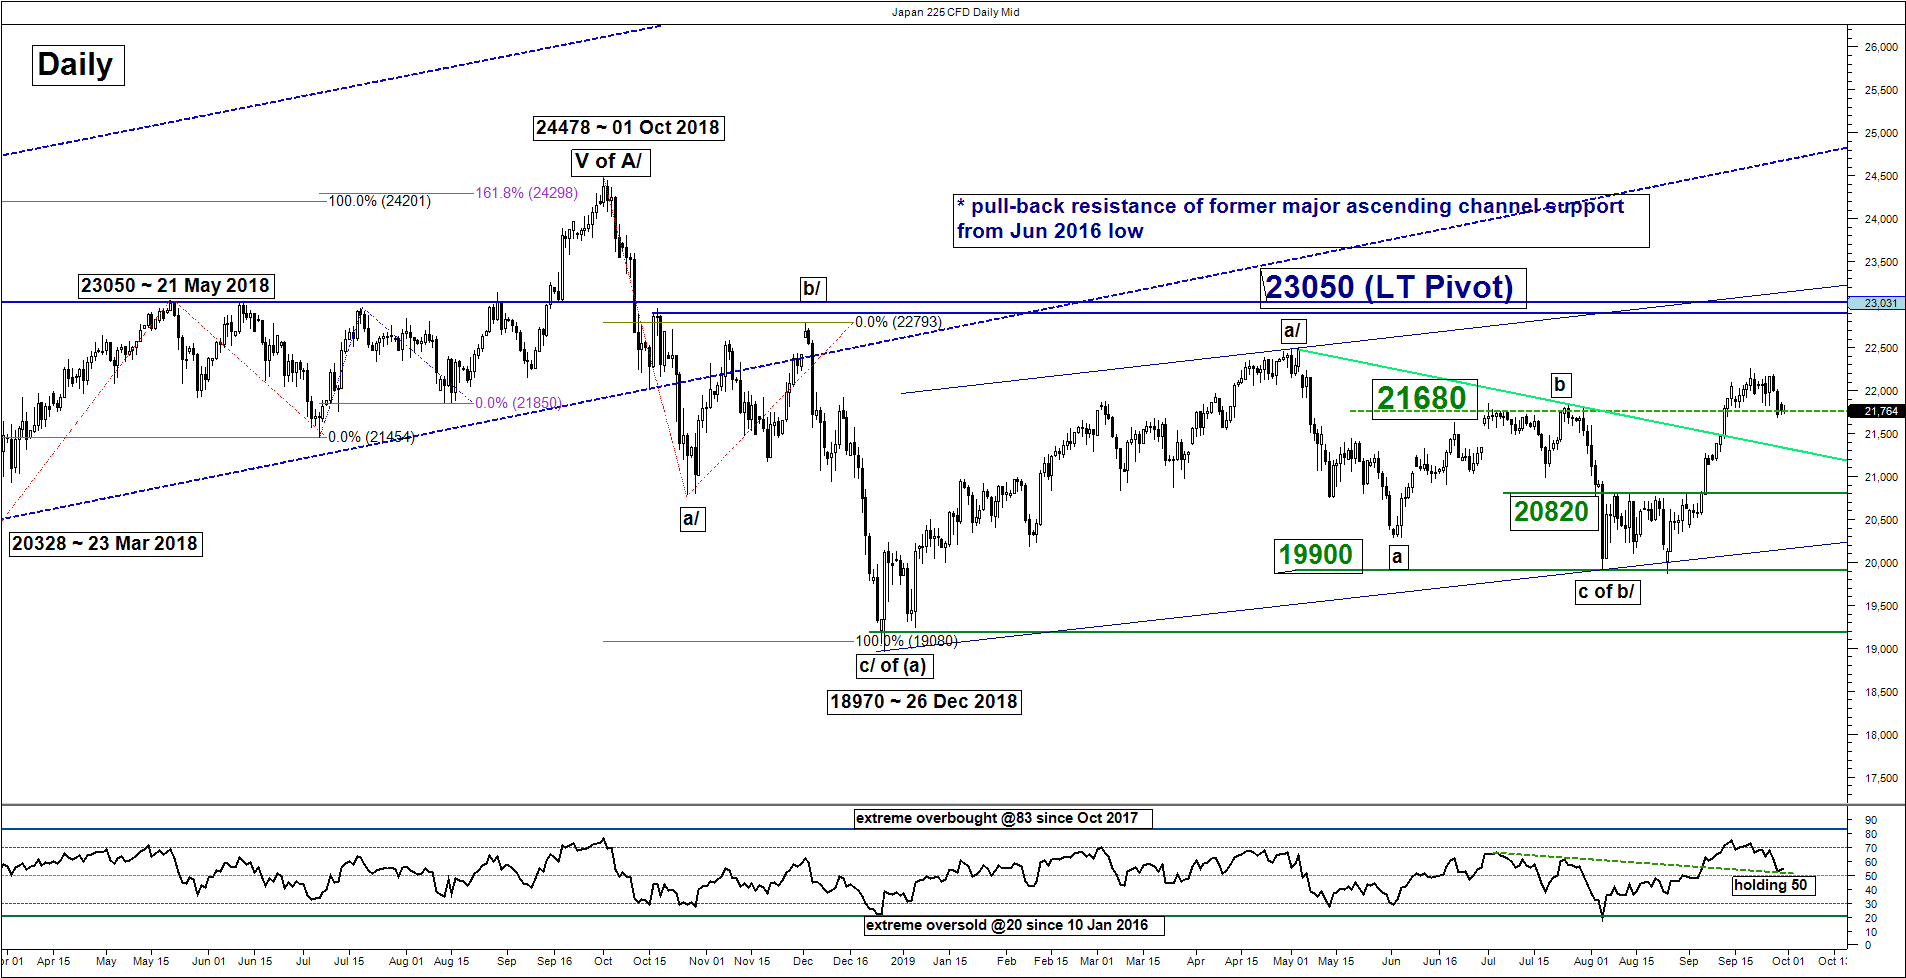
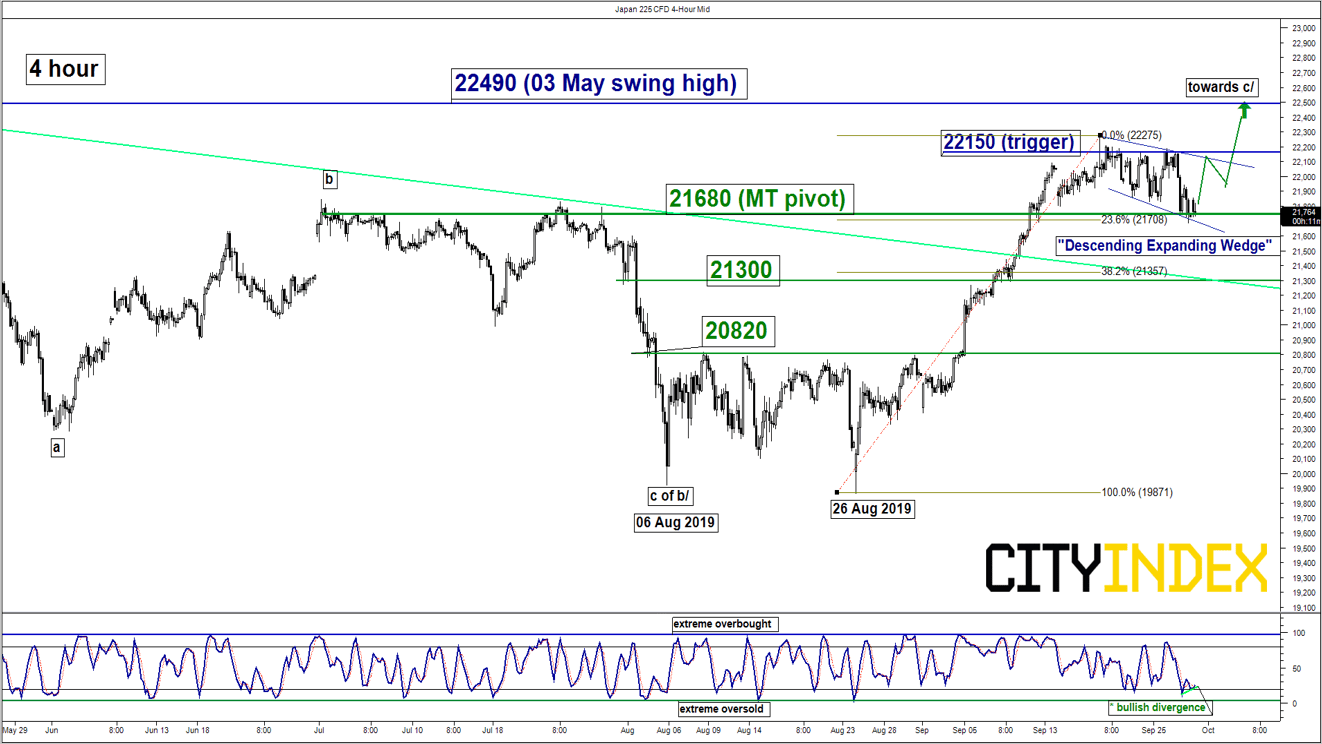
The Japan 225 Index (proxy for the Nikkei 225 futures) has dropped by -2.4% after it traded sideways for 2-weeks since 19 Sep to print a low of 21686 on last Fri, 27 Sep.
Interestingly, the 21686 low coincides with the former range resistance area from 01/30 Jul 2019 and the 23.6% Fibonacci retracement of the recent rally from 26 Aug low to 19 Sep 2019 high. In addition, momentum has started to turn positive where the daily RSI oscillator has managed to hold at a significant corresponding support at the 50 level with a bullish divergence signal seen in the shorter-term 4-hour Stochastic oscillator at its oversold region.
Maintain bullish bias with an adjusted key medium-term pivotal support at 21680 and added 22150 as an upside trigger level for a potential push up to target the 03 May 2019 swing high of 22490 in the first step. On the other hand, a daily close below 21680 invalidates the bullish scenario for deeper corrective decline towards 21300.
Hang Seng – Further potential push down to test major range support
click to enlarge charts
Key Levels (1 to 3 weeks)
Pivot (key resistance): 26500
Supports: 25340 & 24870/500
Next resistances: 27400 & 28000
Directional Bias (1 to 3 weeks)
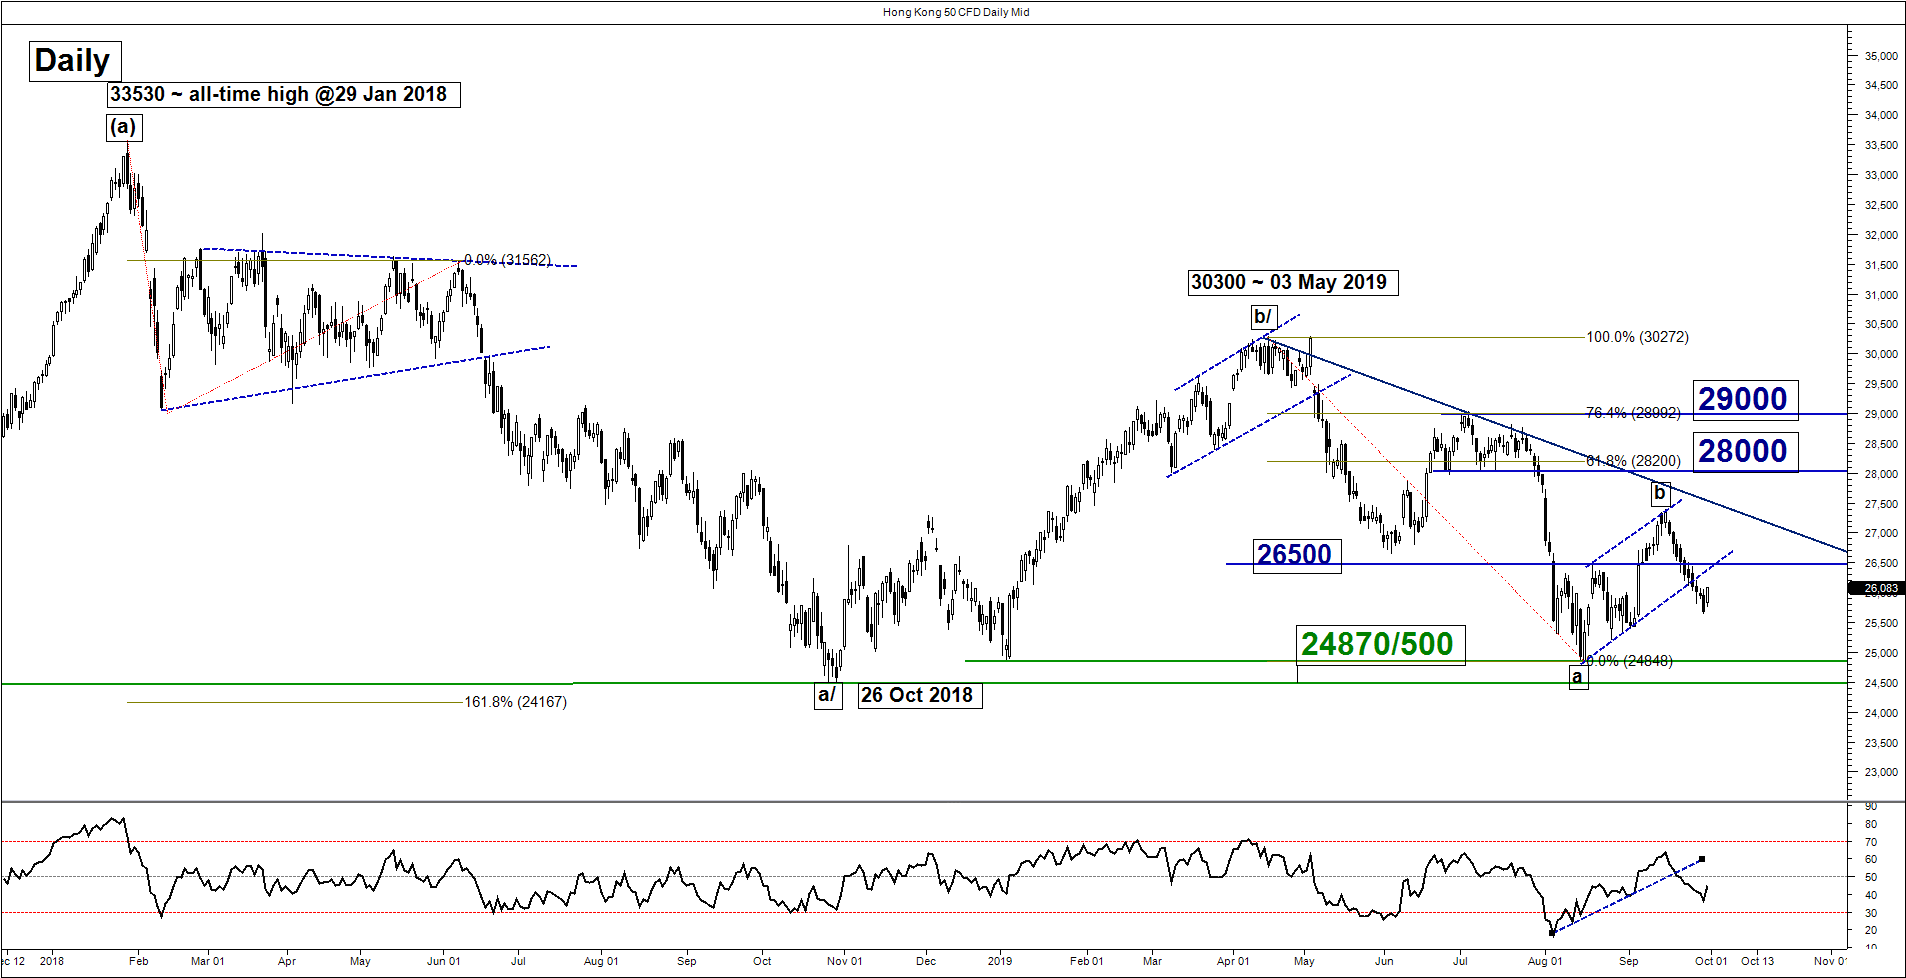
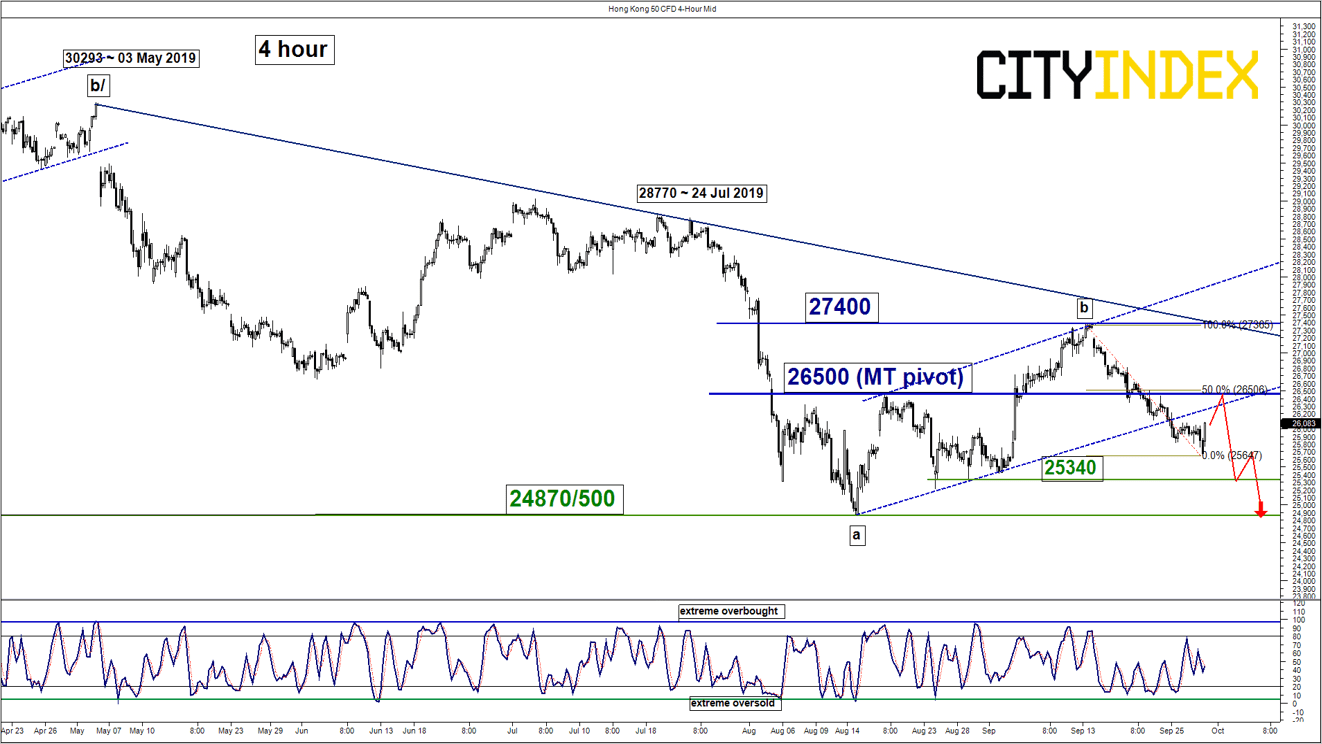
The Hong Kong 50 Index (proxy for Hang Seng Index futures) has broken below the 26400 lower limit of the “neutrality range” as per highlighted in our previous report.
We flip to a bearish bias in any bounces now below 26500 medium-term pivotal resistance (also the 50% Fibonacci retracement of the recent -6.3% decline from 13 Sep high to 27 Sep 2019 low of 25660) for a further potential push down to test the major range support of 24870/500.
On the other hand, a clearance with a daily close above 26500 sees a further push up towards the next resistance at 27400 (13 Sep 2019 swing high & the descending trendline from 03 May 2019 high).
ASX 200 – Eyeing a retest on all-time high area

click to enlarge charts
Key Levels (1 to 3 weeks)
Intermediate support: 6680
Pivot (key support): 6605
Resistances: 6740 & 6851/63
Next support: 6500
Directional Bias (1 to 3 weeks)
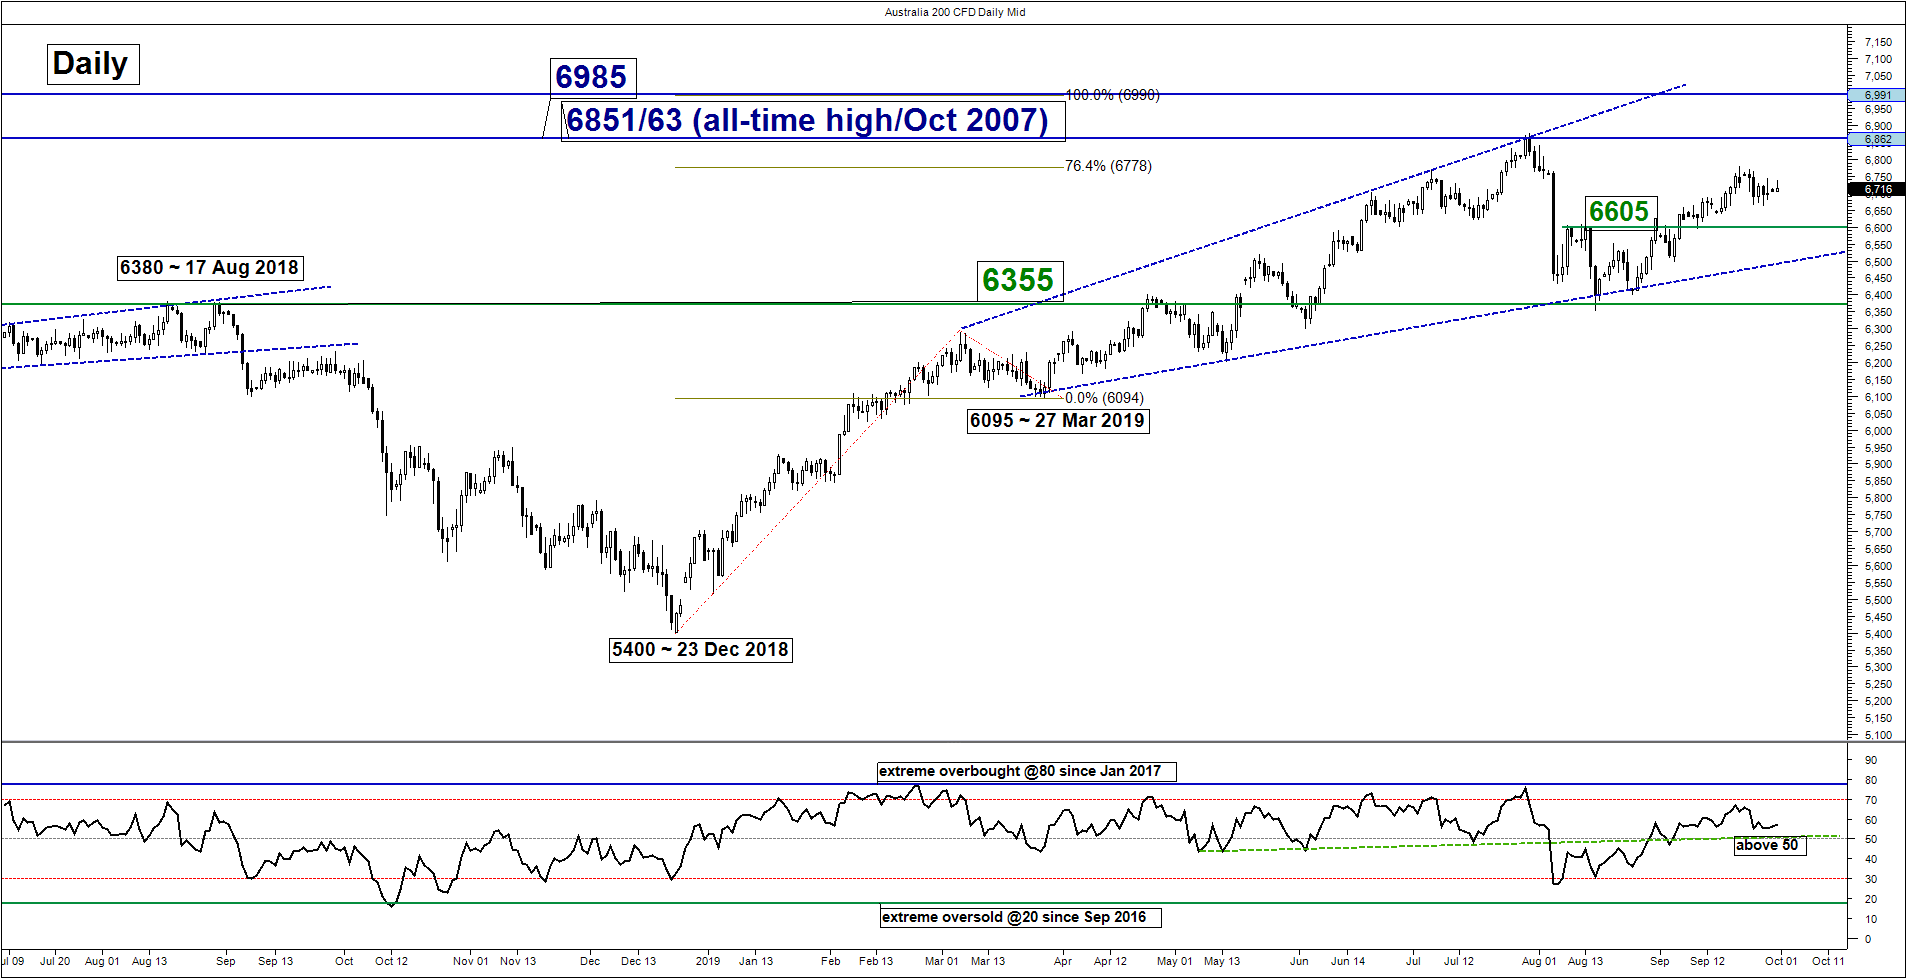
The Australia 200 Index (proxy for the ASX 200 futures) has managed to hit the 6760 first upside target/resistance as per highlighted in our previous report. It printed an intraday high of 678 on 20 Sep before it drifted down by -1.5% and formed minor range support at 6680.
The medium-term uptrend remains intact for Index has last week’s drop has managed to find support and lower boundary of an ascending channel in place since 26 Aug 2019 low with the daily RSI oscillator that is still holding above the 50 level.
Maintain the bullish bias with 6605 remains as the key medium-term pivotal support and added 6740 as the upside trigger level for a further potential push up to retest the all-time high area of 6851/63. On the other hand, a daily close below 6605 invalidates the preferred bullish scenario for a choppy decline back towards 6500 (also the lower boundary of the “Expanding Wedge” configuration in place since 27 Mar 2019 low).
DAX – 12170 remains the key support to watch
click to enlarge charts
Key Levels (1 to 3 weeks)
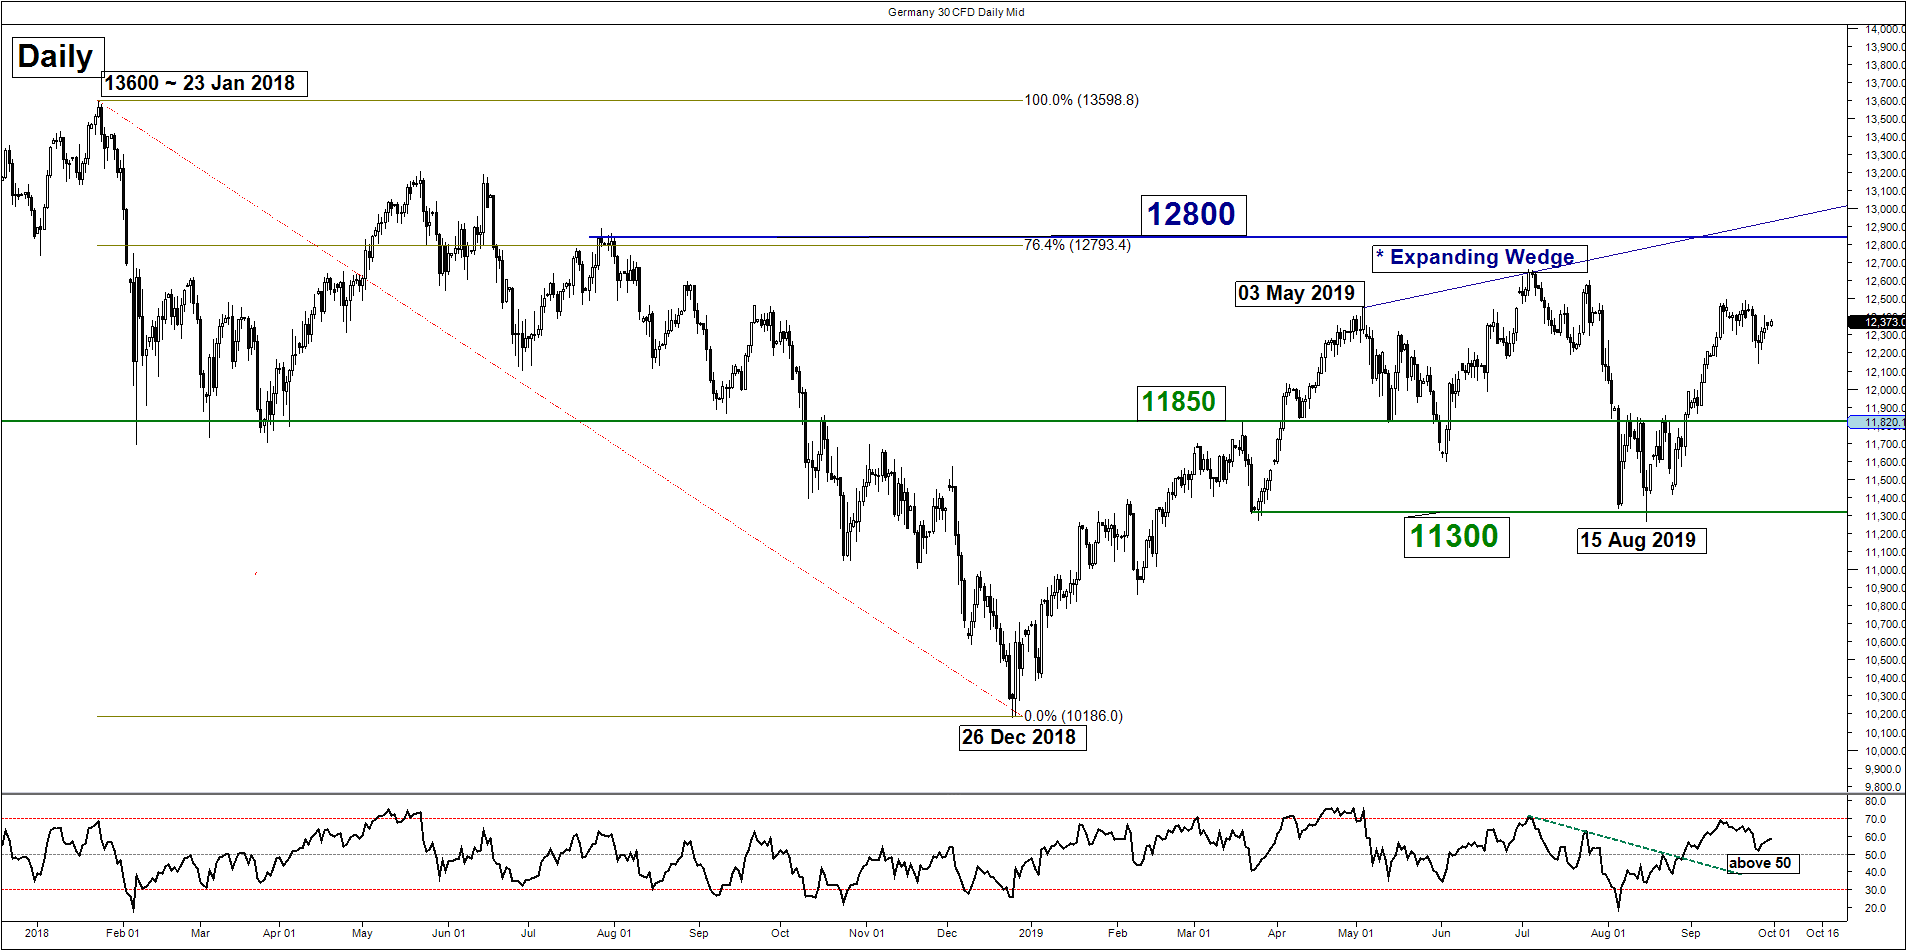
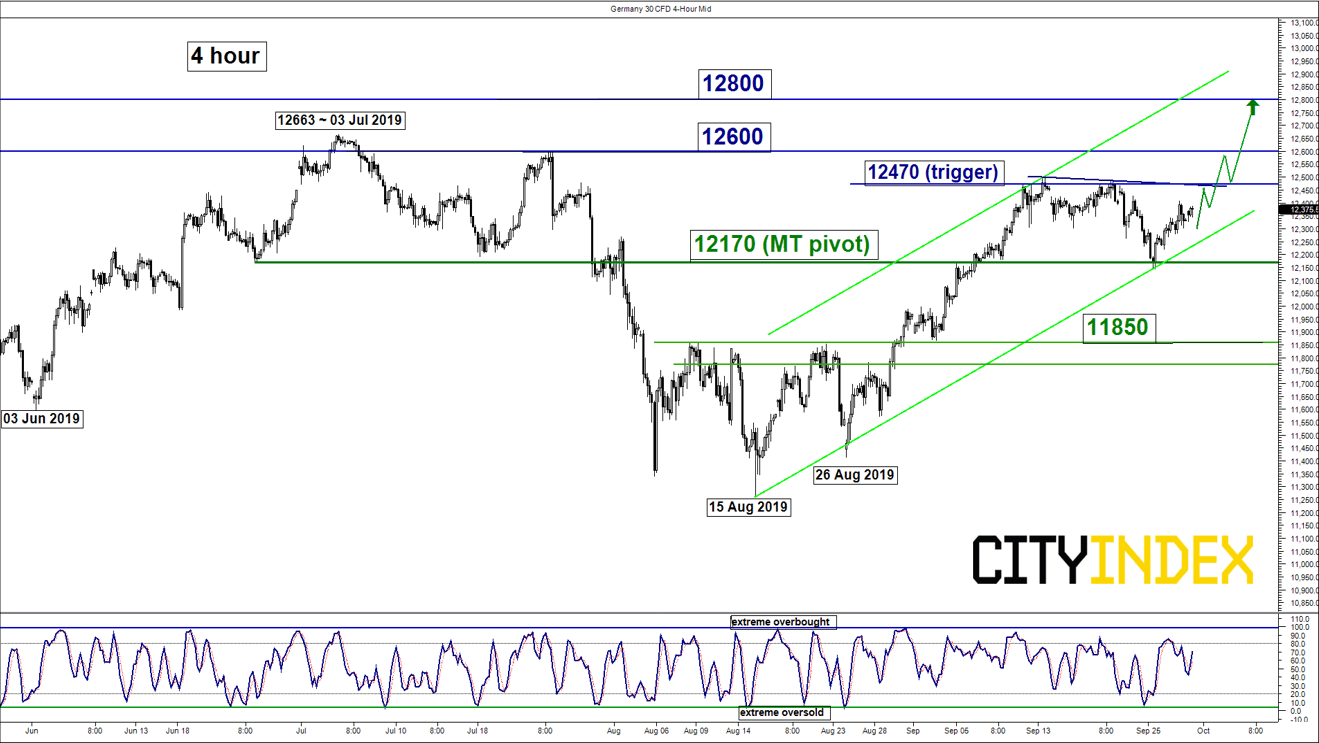
Pivot (key support): 12170
Resistances: 12470, 12600 & 12800
Next support: 11850
Directional Bias (1 to 3 weeks)
The drop of -2.6% seen in the Germany 30 Index (proxy for the DAX futures) from 20 Sep high of 12470 to 25 Sep low of 12140 has managed to stage a bounce from the predefined 12170 key medium-term pivotal support as per highlighted in our previous report.
Key elements remain positive thus we maintain the bullish bias and added 12470 as the upside trigger level to reinforce another potential upleg to target the next resistances at 12600 and 12800 (close to the upper limit of the “Expanding Wedge” & 76.4% Fibonacci retracement of the previous down move from 23 Jan high to 26 Dec 2018 low). On the other hand, a daily close below 12170 invalidates the bullish scenario for a choppy decline back to retest the 11850 pull-back support of the former minor “Double Bottom” configuration neckline resistance.
Charts are from City Index Advantage TraderPro & eSignal
Latest market news
Today 01:15 PM
Today 11:30 AM
Today 08:18 AM
Latest Indices articles
April 18, 2024 04:46 PM
April 17, 2024 11:00 AM
April 16, 2024 08:00 PM
April 16, 2024 04:54 PM