After last week’s pause, the earnings season for London’s biggest companies will resume with a flood of disclosure over the next few days. There’ll be a focus on the FTSE’s four giant banking groups and on three further global miners, after Rio Tinto and Randgold earnings earlier in the month. There’s a big chance of heightened volatility across Britain’s equities market as top-tier stocks with a total capitalisation of almost £1 trillion step up to the plate.
HSBC alone being the FTSE 100’s biggest and heaviest-weighted component has the capacity to make or break the FTSE’s day, when it releases full-year results on Tuesday 21st February. Its final report of the year will be emblematic of many ‘legacy’ issues that continue to hamper it and its main rival Barclays, as well as its UK-focused peers, Lloyds Banking Group and RBS.
HSBC perhaps is further along in the litigation cycle than other big lenders. Keeping track of all charges lenders face isn’t easy though. In January, the group was slapped with a relatively small $33m fine by the U.S. Office of the Comptroller, which overseas federal banking. The point is, the news didn’t appear to be on many analysts’ radars, suggesting further such instances could occur. HSBC had exhibited “unsafe and unsound practices” in how it notified customers about changes in mortgage payments, the OCC said.
The bank has at least eight further issues that are likely to bring settlements amounting to upwards of $5bn over the next five years, on top of the $3.2bn of provisions it already has at the ready.
Bank investors are also keen to hear lenders’ current thinking over Britain’s exit from the European Union, which is looking increasingly likely to cost UK-domicilled banks their direct right to ‘passport’ services into the trading block without question. Whilst the government has made it clear that it will seek transitional arrangements for all business sectors, uncertainty over the kind of deal that is eventually made for financial services, not to mention the timing, will remain heightened for years.
Banks have signalled that they won’t wait for full agreements to be formulated and will move at least some operations into the EU to ensure business can continue unfettered.
HSBC said last month that it will relocate staff responsible for generating around a fifth of its UK-based trading revenue to Paris. This would happen in two years’ time, CEO Stuart Gulliver said. The turnover involved is relatively small in the context of the wider group, but the blow to sentiment in the market and The City from such decisions—with more very probably imminent—has a cost which is more difficult to quantify. Aware of this, banks have been careful to make limited pronouncements about such plans. They may provide more detail this week.
The outlook for HSBC
Investors also want to hear where HSBC now stands with plans, announced with great fanfare a year and a half ago, to establish a significant franchise in China. HSBC is still waiting for official approval for a partnership with a state-owned fund. The group offered no timeline for its push into the fast growing Qianhai free-trade zone in Shenzhen, but investors are getting restive over the risk of the group losing market share. Bad news about how its plans are shaping up risks a marked impact on the shares.
HSBC’s net interest margin is forecast to be flat at 1.9% at the end of 2016, with a 7.4% slide in net interest income to $30bn, leaving reported pre-tax profit of $14.2bn, down by a quarter on the year before.
Lloyds Banking Group will release its final 2016 results on Wednesday 22nd February. Lloyds has also recently been in the news over its plans to retain EU access. It is reportedly on the verge of applying for a license to turn a branch in Berlin into a subsidiary. As the only large British lender without an EU subsidiary its need for one is more acute, despite the bulk of its assets being located in the UK. Whilst Frankfurt is the German City where most large banks typically establish a base, Lloyds has a full management team in the capital, where they operate the group’s main European hub. There is a capital cost for establishing a bank subsidiary in order to meet regulatory requirements.
Closer to home, it now looks likely that the group will be fully ensnared in a high-profile fraud case that involved former employees and cost a number of businesses about £245m. Six people, including former bankers from Lloyds’ HBOS unit, were found guilty of a scam over fraudulent loans. They were sent to prison for a total of 47 years earlier this month. Whilst Lloyds was legally treated as a third party in the case, without direct culpability, it has been under pressure to compensate victims. After parliamentary intervention, Lloyds said it will appoint an independent entity to review the cases of hundreds of businesses, many of which went into liquidation.
The HBOS fraud is the group’s latest conduct case, and may not be the only one which it gives airtime to with its results. However Lloyds’ most infamous and longest running legal issue, surrounding payment protection insurance (PPI) is not expected to require further provisions after the group added another £1bn to these last year, taking its total provision for PPI to £17bn. The group calculates that it has set aside as much as it needs to cover any claims made before the Financial Conduct Authority’s mid-2019 deadline, a year later than most lenders were expecting.
The group’s key regulatory capital ratio (Common Equity Tier One, or CET1) rose to 13.4% from 13% last year. The ratio is likely to have ticked back below 13% again since then, partly due to the group’s acquisition of credit card company MBNA, late in 2016. Investors will also be interested to hear the latest on Lloyds’ pension scheme, which moved into deficit last year to the tune of £740m having been in surplus by more than £400m.
Lloyds’s net interest margin is forecast to rise by a tenth of a percentage point to 2.7%, whilst net interest income is seen 1.8% higher at £11.52bn. A number of beneficial exceptional items, plus the absence of dozens impairments that hit the group’s finals in 2015 will enable it to report a big jump in pre-tax profits to £4.8bn, according to the average of estimates compiled by Thomson Reuters.
What about Barclays?
The focus moves to Barclays for its full-year results on Thursday 23rd February. As the last remaining British bank with significant exposure to riskier activities like trading and overseas corporate and investment banking, the group’s model has stood it in good stead amid the financial market volatility over the last year. Return on tangible equity in the group’s Corporate & International business advanced 330 basis points to 14.3% in the first half. It fell back to 10% in Q3 but was still outperforming pure-play European investment banks. The better result in the first half of last year did however contain the effect of a number noisy ‘exceptionals’ and whether or not the group’s most risk-exposed division continued to provide an offset to those risks in the final quarter, with similarly punchy returns, will be a watch point.
At 11.6%, the group’s CET1 is well below the level which most international regulators would regard as ideal for a lender of its size. Shareholders will be more inclined to look askance at Barclay’s riskier businesses, if the ratio keeps falling from here.
On the conduct side, Barclays most recently faced scrutiny due to the beginning of the first trials related to alleged European interbank interest rates (Euribor) manipulation. Six bankers from Deutsche, Société Générale and Barclays last month faced the first charges for conspiring to manipulate the European benchmark rate. It’s not clear whether institutions may eventually face charges and the case continues. The group is contesting its own residential mortgage-backed securities case with the U.S. Department of Justice. A settlement is expected sometime this year. The group has not ruled out further provisions for RMBS penalties.
Barclays’ net interest margin is set to inch 1.3% lower to 1.7%. The group’s typically volatile net interest income is forecast to slump 21% to £9.9bn, though that would be an improvement on the 50% slide at the end of its 2015 financial year. Core profits formulated as earnings before interest and taxation (EBIT) will tumble 35% to £4.8bn, according to institutional investors’ forecasts.
RBS reports too on Friday
Investors’ focus for what will probably be yet another messy set of Royal Bank of Scotland results on Friday 24th February is likely to be on job cuts. The group is targeting over £800m in operating costs by means of headcount reduction and branch closures and says it will reveal new plans for a return to profitability with its final results of the year. Some news reports have cited cuts of up to 15,000 jobs, which would be 18% of its 82,500 staff. The group said it did “not recognise” such a plan. However, the bank’s cost-to-income ratio remains stubbornly above 50%, no thanks to the Bank of England’s interest rate cut last year, and RBS’s CEO Ross McEwan will now need to redouble efforts to get costs below that threshold, his stated target. This suggests a cull of expenses to the tune of up to £1bn will probably be seen during 2017, though it may not all be announced with the group’s forthcoming earnings.
On the litigation front, the group this month rejected requests to increase compensation to victims of RBS’s now defunct Global Restructuring Group after agreeing a £400m scheme last year. RBS may still be quizzed about the matter by shareholders and the media, given that legal action continues. Investigative reports claim to have upturned new evidence which supports allegations that RBS tried to profit from struggling businesses. GRG has been accused of pushing some companies into bankruptcy so it could pick up their assets more cheaply. The FCA is set to release a full account of its findings on GRG once it has completed investigations into issues raised by a so-called “skilled person” review. Separate and ongoing litigation already has claims worth £2bn.
Earlier this month, a former vice-chairman of the bank and, the founder of transport group Stagecoach said they were joining a separate civil prosecution, set to start in May, by investors who claim they were misled over RBS’s huge rights issue at the peak of the financial crisis in 2008.
Provisions for the GRG and financial crisis cases, PPI, an eventual settlement of a RBS’s own RMBS case in the states and many others, are the main reason why the group has not reported a profit since 2008. Cash set aside includes £3.8bn for PPI and £2.5bn for RMBS.
Another quarterly loss at RBS is in the bag after the £469m loss attributable to shareholders in Q3, and this is expected to contribute to RBS’s 9th consecutive annual loss. That is forecast to be around £1.26bn, after an almost £2bn loss for the 2015 financial year.
What next for mining giants?
The three remaining FTSE 100 mining giants Anglo American, BHP Billiton, Glencore have results on tap this week. Anglo and BHP are scheduled on Tuesday 21st February, with Glencore on Thursday 23rd February. The final quarter of 2016 is showing the strongest signs yet that global miners have dug themselves out of a hole. 2017 even looks set to bring the first increases in spending by the FTSE’s biggest miners, Glencore, BHP, and Rio Tinto for half a decade.
That and the so-called ‘reflation rally’ stoked by investor hopes that President Donald Trump will trigger a fiscal renaissance, have refuelled an advance of mining shares despite several having gained by triple-digit percentages in 2016. After spending fell by two-thirds from a 2012 peak of $21.5bn, according to S&P Global Market Intelligence, Australia’s Association of Mining and Exploration Companies says drilling on new ground, was up 75% in last year’s third quarter from the second quarter alone. The rebound of most metals prices from late-2015 lows is a partial explanation, though brutal cost and debt reductions across the board have arguably been more important. Over the last year or so, such exercises have gone a long way toward reassuring investors that the new cycle has better profit potential.
Earlier this month, Randgold Resources unveiled a 72% surge in cash flow for the fourth quarter, overshooting its target for the year and enabling a 52% hike in the annual dividend. That group, and Rio Tinto, which reported results around the same time, have set a high bar for other miners’ results in terms of free cash flow generation, debt reduction and dividends.
Glencore is leading the charge in acquisitions. Last week it announced the latest in a string of deals, a $960m buy of a stake in the Mutanda copper and cobalt mine in Katanga, Democratic Republic of Congo. In January it said it was considering further takeovers of sugar and ethanol mills in Brazil after buying a second plant there. The group is ramping up its agricultural operations after having been forced to sell a large asset in the space in order to reduce debt last year. The value of Glencore’s largest transaction so far this year was not disclosed. A three way deal with Qatar’s sovereign wealth fund, and Italy’s Intesa San Paolo bank saw the purchase of 19.5% of Russia’s state-controlled Rosneft oil group. Whilst Russia sold the stake for $10.2bn, it’s not known how much Glencore paid.
Glencore is forecast to report a 2% fall in revenues for 2016 at $167bn, whilst EBIT is expected to rise almost 60% to $3.45bn. The group’s infamous net debt is seen at $24.6bn, down 5%, free cash flow will begin to be depleted, after last year’s flood of asset sales reaped a bumper $7.9bn by year end.
Anglo American revenues are expected to rise 7% at $21.8bn, with EBIT likely at $3.54bn up from $2.2bn in the year before.
BHP Billiton should post one of the best revenue results among its global rivals if revenues rise to $40.5bn in 2016, up 31%, as per consensus forecasts. Core income (EBIT) could jump almost 35% to $14bn.
Is a stock market sell-off inevitable?
US stock markets reached multiple record highs last week, there is lots of chatter about a potential sell-off, and risks are definitely rising, but is a sell off really inevitable at this stage? As analysts and economists fret about potential sell-signals, the markets are grinding higher, and risk appetite is strong across the board.
The S&P 500 has rallied more than 250% since the financial crisis, and another 12% since President Trump won the US election in November. The Dow Jones is well above 20,000, and the Vix is close to record lows. Even emerging market currencies are starting to join the party, the South African rand is up more than 5.5% versus the US dollar since the start of this year.
So, are financial markets ripe for a sell-off? This report will analyse some of the most common sell-signals out there, and urge you to use them with caution. It will also conclude that perhaps the most reliable sell-signal of all could be what you least expect.
But are financial markets in a bubble?
To answer this question you need to define what a bubble actually is. Last week’s Buttonwood report in the Economist quotes one definition from William Goetzmann of Yale School of Management who defines a bubble as a doubling in a market’s value, followed by a 50% decline. The trouble with this definition, Goetzmann found, that over five years markets are much more likely to double again rather than fall by half. Thus, even the term bubble is troublesome.
Beware using P/E ratios as a sell signal
Another way to define if a market is about to sell-off is valuation, if stocks are considered too expensive they should fall in price, right? The chart below shows the price to earnings ratio for the S&P 500, going back to 1960. Over the long-term the P/E ratio has not been a reliable guide for when markets will see off, apart from the dot.com bubble when P/E ratios reached their highest ever levels. Thus, a rising P/E ratio, it is currently at 21, does not necessarily mean that a market will change direction any time soon.
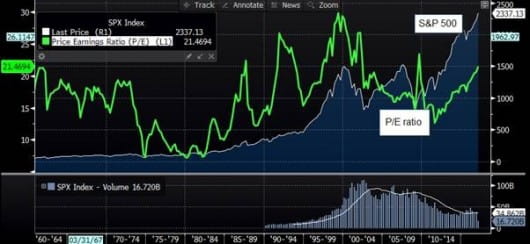
Source: City Index and Bloomberg
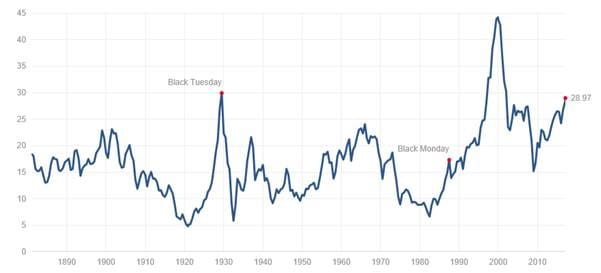
Some traders prefer to use the Cyclically Adjusted P/E ratio (CAPE), which was formulated by economist Robert Shiller. This uses average earnings, which some believe is a more accurate gauge of market valuation. The S&P 500’s current CAPE is 28 (see chart below), before the 1929 crash this peaked at 30, but its highest ever level occurred right before the dot.com bubble burst when it reached 45, so there could be more room for a further increase in the CAPE ratio before any sell off may, or may not, happen.
Figure 2:
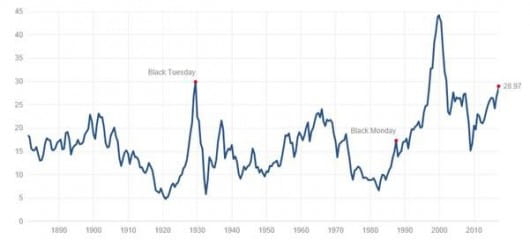
Source: www.multpl.com
There is a wider debate going on about the relevance of P/E ratios in today’s environment, especially with an ever growing number of large multi-nationals that are big enough to buy back stock or go on an M&A spree to try and eke out growth. Some argue that P/E ratios may have reached a permanently high plateau, and thus are no use at predicting a potential market sell –off.
You can’t rely on volume data either…
Another measure of stock market health is tracking market volume. The perceived wisdom is that stock market rallies on low volume suggest that investors do not have confidence in the said rally. While larger than normal volume can be a sign that traders are confident about the market rally. However, volume has been steadily declining since the financial crisis, as you can see below. So, if you had adhered to this theory, then you would have missed the 250% increase in the S&P 500 since the 2009 low. Thus, volume indicators do not appear to be a reliable red flag for market vulnerability either.
Figure 3:
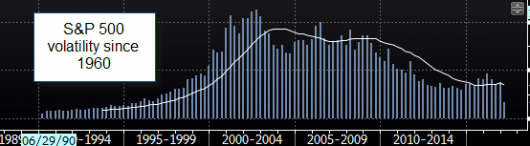
Source: City Index and Bloomberg
To conclude, it is very difficult to pick the top in a market. As this analysis shows, sharp sell offs in markets are fairly rare events, and markets tend to bounce back. Ultimately, the red flags that have traditionally been used to determine when a market is ripe for a sell-off tend to be wrong more often than they are right.
Could President Trump provide the most reliable sell signal?
In this environment, perhaps the biggest threat of a market sell-off comes from Donald Trump, who has made big promises on fiscal policy and financial regulation, which have fuelled the rally in equity markets since November. If he has over-promised, but under-delivers, then we could see investors lose faith and markets start to tumble.