Week Ahead Dow at 20 000 but where next
Why the Dow at 20,000 is good not “great” Trump’s problem with the strong dollar FTSE 100 outlook: steady as she goes… Look Ahead: Gold […]
Why the Dow at 20,000 is good not “great” Trump’s problem with the strong dollar FTSE 100 outlook: steady as she goes… Look Ahead: Gold […]
1, Why the Dow at 20,000 is good not “great”
The so-called ‘Trump trade’ strikes back and finally takes the Dow 20K prize. The President didn’t miss the chance to tag the largely symbolic win as partly his doing with an inevitable tweet —”Great! #Dow20K”.
Mostly though, Trump has had little directly to do with the trade flows named, not without irony, after him.
In a world of ‘animal spirits’ it seems to matter when the President rattles off a barrage of executive orders within days of taking office. Less so that they were already well-flagged, or that so far, are barely economically accretive: the wall along the border with Mexico, Obamacare repeal and certain temporary immigration controls.
A raft of solid quarterly figures by major-name companies is playing a bigger part. The tally of better-than-expected earnings now stands around 70% of the 100 or so S&P 500 firms to have reported so far. A busy, well-publicised slate of briefings with dozens of business leaders telegraphed optimism too.
And for now, market momentum continues to be partly fuelled by that optimism on Trump’s zeal for deregulation, tax cuts, and fiscal stimulus. But the same ‘Trump-flation’ uncertainties—lack of policy detail, a Republican rather than anti-establishment Congress—remain.
Thank the banks
The question is whether the market is more or less at risk of a reversal now, than in late December. The 8-year uptrend makes is making many participants reluctant to opt for conventional logic, but that ascent also brought regular harsh lessons for uber-optimists. And right now, bullishness is pervasive. The Dow’s trailing P/E of 20.6 is the highest in 7 years. That sets a high bar for upside earnings surprises to justify the rich rating. The current Wall St consensus for Q4 earnings to grow 6.8% year-on-year—according to Thomson Reuters data—won’t quite cut it, if accurate.
Furthermore, most of the heavy lifting that powered the Dow to its magic barrier was done by relatively few market segments, mainly financials. Banks have been among the best performers since the election on 8th November, but Goldman Sachs alone accounts for some 170 points of the market’s 42-session surge above 19,000, the largest contribution by one stock. Together with rival JPMorgan, GS contributed 20% of the rise.
The other Trump risk, protectionist trade measures, is also not far from investors’ minds. Diplomatic language out of China this week, calling such a scenario a “lose-lose” situation, is a clear enough threat of retaliation against tariffs which Trump has said could be as high as 45%.
Still, the Dow’s largely symbolic importance for the American stock market is also of course blessing. DJIA is no longer a benchmark. Data from S&P Dow Jones Indices shows $35.9bn indexed against DJIA vs. $2.1T against the S&P 500. The most influential market participants will therefore take the Dow’s achievement of a nice round number as just that.
Technical outlook
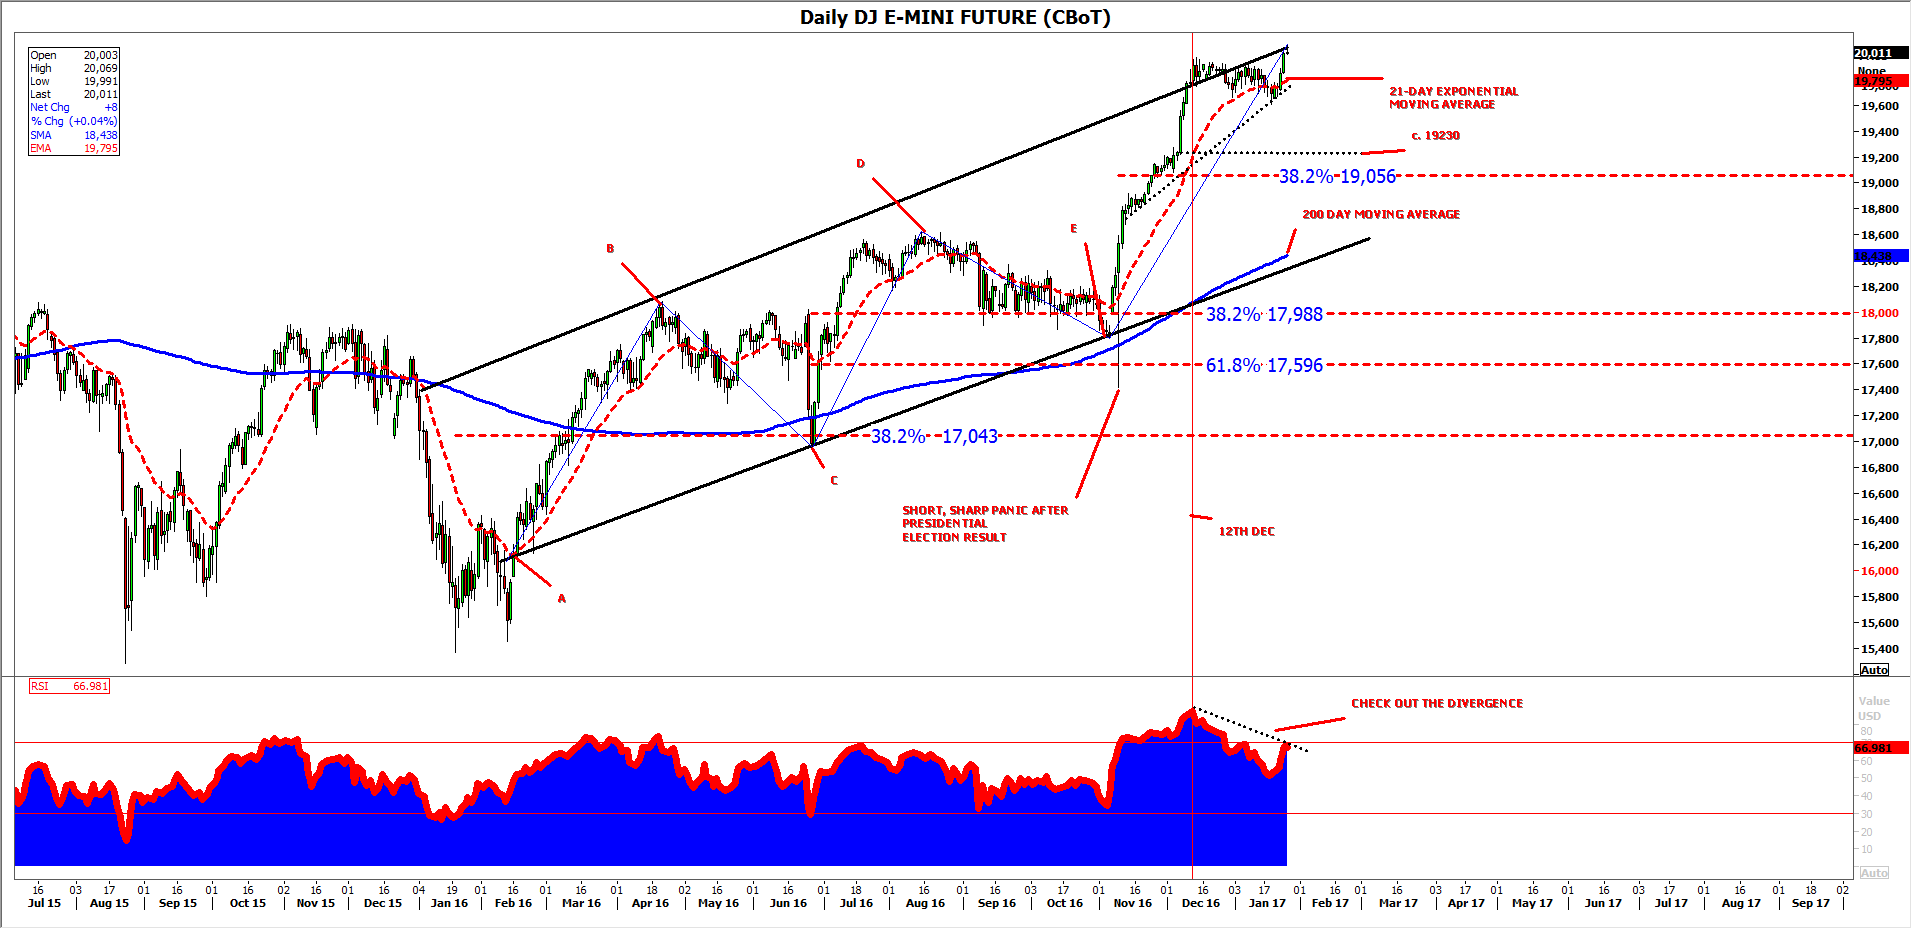
We can partly get round the slight pointlessness of technically analysing DJIA by looking at traded derivatives. Chicago Board of Trade’s e-mini future, charted below, is the closest corollary.
Like the underlying, the contract’s retracements within a reasonably clean channel since February 2016 have been sufficiently symmetrical and less than 100% of the preceding legs. (I am inclined to disregard the manic and short-lived breach of the parallel channel equating to the market’s flash of panic on the morning of the 9th November, when it became clear Donald Trump had won the election.)
With 38.2% retracements at B-C and D-E, the market (mostly!) gives the impression of orderly proceedings, backed by tests, or near tests of the closely watched gauge of annual health, the 200-day moving average.
The question of overbought momentum is less easy to sidestep, though the index’s incursion above the upper bound of its current rising channel looks more irrepressible than exhausted. Even here though, a rising wedge formed of the upper trend and a shorter-term line since 10th November would normally be expected to presage a break lower were it not theoretically misplaced in a rising trend.
A divergent Relative Strength Index (RSI), clear to the naked eye since 12th December, can be interpreted as momentum (or ‘sentiment’ or ‘conviction’) weakening, even as prices run higher. The market can of course continue to advance even when technically overbought and, as I write, the unwinding of the RSI from that state since mid-December can buy the rally more time.
The first sign that this time has run out might well be the triangle break out (as in break down) we mentioned earlier. Further confirmation would be its inability to capitalise on support implied by the impulsive up leg beginning around 19230, with better probability of more downside from a deeper extension than 38.2%.
Figure 1:
Source: City Index
2, Trump’s problem with the strong dollar
The first week of Donald Trump’s Presidency may have been undeniably good for US stock indices, particularly if you are a stock market bull, but the same can’t be said for the dollar. The greenback is the worst performing currency in the G10 so far this year, and only managed to scrape back some gains versus the commodity currencies last week.
This is an interesting junction for the US currency. The bull market triggered by President Trump’s election win had seen US stocks, equities and bonds rise in unison at the end of last year. However, in recent weeks this link has been broken, with stocks and bond yields rising yet the dollar faltering. Last week a new risk factor emerged for FX traders: US politics.
Both President Trump and his choice of Treasury Secretary, Steven Mnuchin, spoke about the dangers of a strong dollar to the US economy. This has stemmed buying in the greenback as investors ponder the impact of political risk on the greenback. Asset prices have been sensitive to comments from Trump, remember what his tweet about Boeing late last year did to the share price? Thus, it is no wonder that investors are taking no chances when it comes to Trump’s chatter about the dollar, and a political premium could limit gains in the buck going forward.
We doubt that Trump will change his tune about the dollar anytime soon, especially after Caterpillar, the US machinery maker, reported weaker than expected results late last week. It cited the strong dollar as one reason why overseas demand for its products was weak. Since Trump has modelled himself as a ‘pro-business’ President, anything that threatens US business, such as the strong dollar, is likely to become a target of Trump’s ire.
Looking ahead to this week, we will be watching to see if the first Fed meeting of the year can stem the decline in the US dollar. The market expects no change, and we don’t get a Yellen press conference this time, we will have to make do with a statement only. However, we expect the Fed to continue to have a mildly hawkish tone and continue to sound concerned about the prospect of rising inflation. This will be a big test for the dollar, will it have a stronger reaction to the Fed, or to Trump and co. at the White House? On balance we expect Trump to have a greater influence, however, we expect volatility in the buck to rise in the coming days.
From a technical perspective, 100.00 proved to be strong support for the dollar index last week, however, due to the political premium mentioned above, upside in the dollar could be limited in the coming days. Key resistance lies at 101.65 – the 50-day sma.
3, FTSE 100: steady as she goes
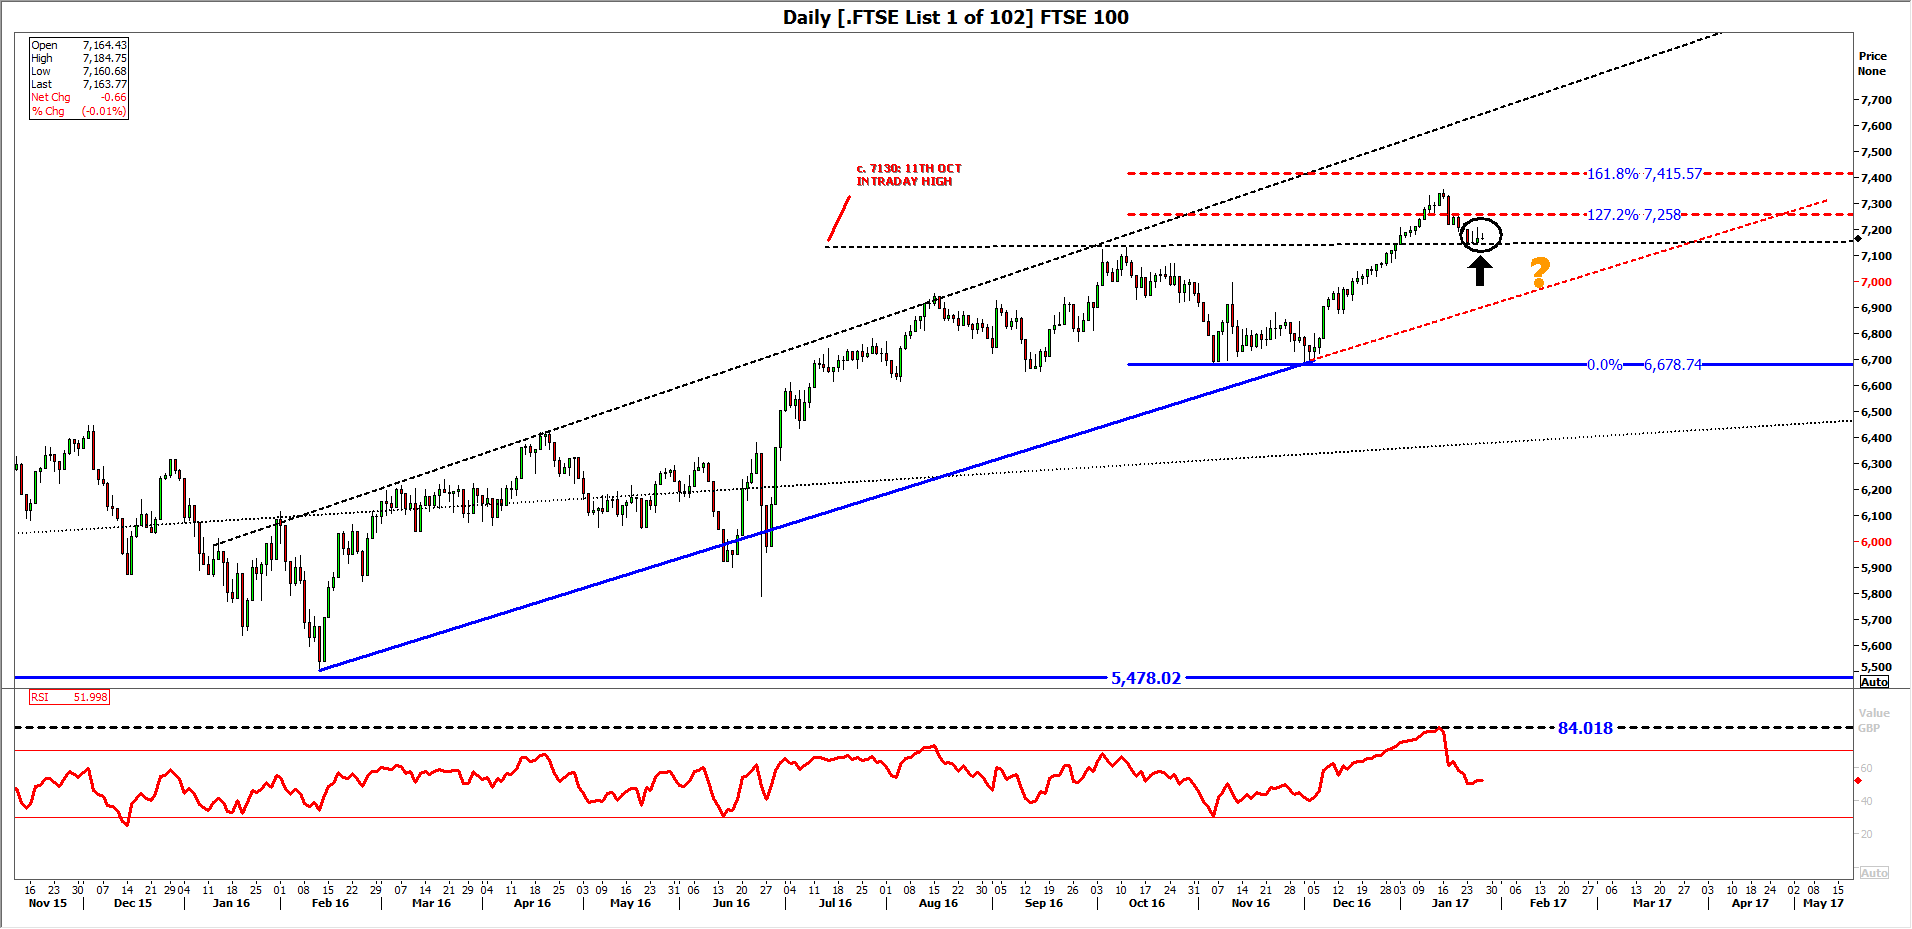
The FTSE 100’s progress turgid since 8th November has in fact been just as turgid as the Dow’s 20K drama, but somehow the UK benchmark has become something of a sideshow. Both indices have advanced around 10% since that date though, and both have marked new records.
The current blue-chip earnings season sheds more light on the very near-term outlook. What’s most important to note here is that earnings expectations are re-rating from the exceptionally low levels of the year before. For the FTSE, heavily weighted—as in technically weighted—by mining and oil shares, price routs in commodities and oil in the second half of 2015 and early 2016 depressed Q4 2016 earnings significantly.
It is the rebound of commodities prices that is reflected in forecasts that FTSE 100 earnings will rise 81.5% in Q4 compared to the same quarter before. (The source is Thomson Reuters I/B/E/S.) There’s a similar dynamic over at banks, particularly at the FTSE’s least UK-orientated lender, HSBC, which happens to be the biggest contributor to the index’s direction, followed by Shell, BP and BAT.
A robust earnings season will go a long way to ‘correcting’ the market’s out of kilter trailing price/earnings ratio, which whilst in the thirties (having almost touched 40 times in August) is still twice generally accepted historical average. Even without a rebasing of earnings expectations, a more economically inclusive version of the market’s rating, such as the cyclically adjusted price/earnings ratio (CAPE) points to a less outlandish forward P/E of around 15 times for 2017
More convincing valuation metrics are useful grist to the mill for the FTSE’s price progress, which has been hesitant, if steady. Even so, prevailing basic technical chart factors seem to paint a better outlook than for its more eye-catching American counterpart.
After the UK benchmark’s latest peaks (at 7354.14 intraday on 16th January; and 7337.81 on a closing basis on 13th January) the market duly headed back to the most essential point of confirmation at 7130, a prior resistance formed by highs in October. That confirmation may be in, judging by the bounce on Wednesday 25th January, though weak trading a day later is a caution. Again, the appropriate momentum study (Relative Strength Index) is far less overstretched than on major U.S. indices.
Figure 2:
Source: City Index
4, Look ahead: gold
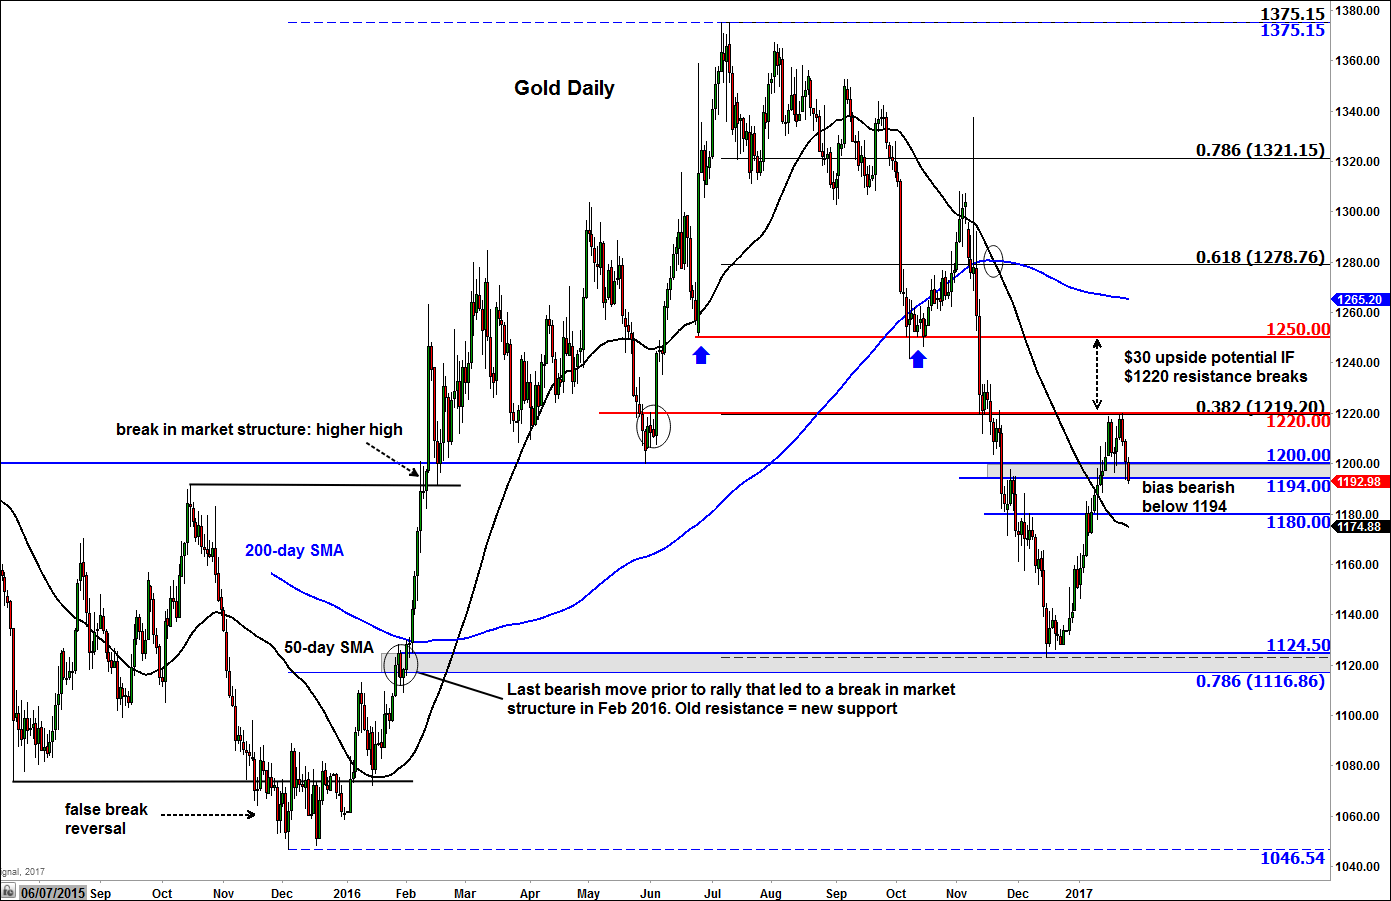
After rising for four straight weeks, precious metals have fallen sharply so this week. Investors appear to be buying equities and possibly the dollar in favour of perceived safe-haven assets, as evidenced, for example, by the Dow climbing above the 20,000 hurdle for the first time and the Dollar Index finding some support around the key 100 level. If the current trend of rising equities and the dollar continues then gold and silver could fall sharply. From a technical point of view, gold looks poised for a drop if the $1194 support gives way now. This appears likely given that $1220 resistance level – which marks the 38.2% Fibonacci retracement level and a pivotal support/resistance level from the past – has held firm. If this turns out to be the high for gold this quarter then it would represent a shallow pullback (38.2%), meaning the potential falls could be huge. If the metal does break $1194 support then a drop to at least $1180 would become likely, possibly a lot lower over time. Conversely, if gold finds unexpected support and goes on to break the $1220 resistance level then it will likely go up sharply. In this scenario, the next bullish objective would be at $1250, which was previously support.
Figure 3:
Source: eSignal and City Index.
5, Look ahead: NZD/USD
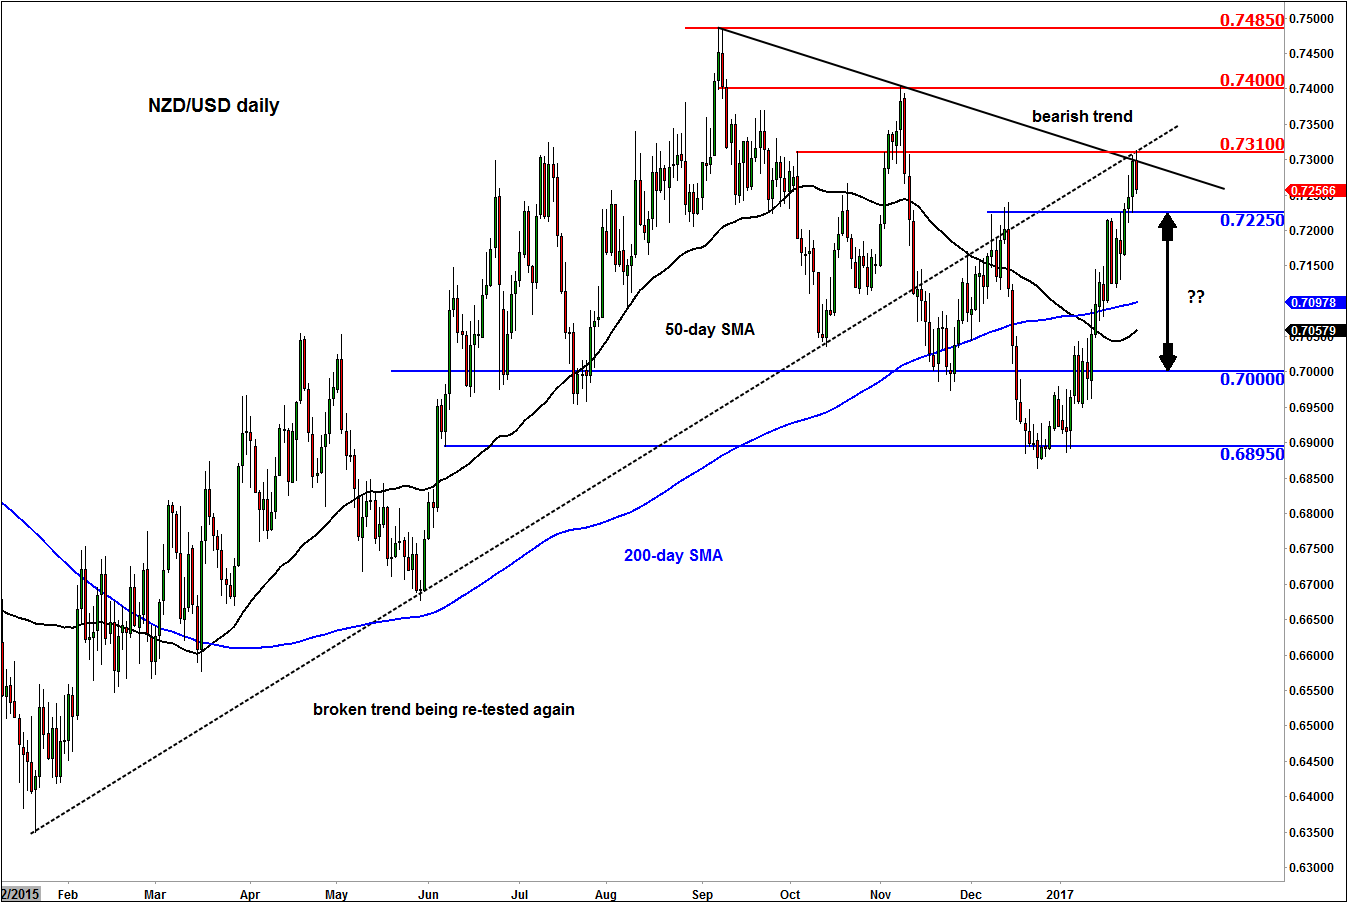
The NZD/USD failed to maintain its gains on Thursday despite news that inflation in New Zealand had risen by a bigger-than-expected 0.4% in the fourth quarter versus 0.3% expected. When price fails to respond in the way you would reasonably expect it to is usually a sign that the trend may be about to change. Interestingly, the NZD/USD reached a technical resistance level at 0.7310 before heading lower. As can be seen, this level converges with several factors, namely (1) the backside of the broken bullish trend line, (2) the underside of the bearish trend line and (3) previous support and resistance level. For the sellers to take full control of the kiwi again they will need to reclaim the broken resistance at 0.7225 now, ideally on a daily closing basis. If successful, this would potentially pave the way for a move back towards 0.7000 support, with the 50- and 200-day moving averages being additional bearish targets in the interim. Alternatively, if resistance at 0.7310 breaks then the kiwi may go on to test prior reference points at 0.7400 or 0.7485 before deciding on its next move.
Figure 4:
Source: eSignal and City Index.