Week Ahead Dissecting a Trump Presidency for the market
Trump shock fails to ignite market volatility The Trump Presidency and bond yields Indices view Stock market view Look Ahead Commodities Look ahead FX […]
Trump shock fails to ignite market volatility The Trump Presidency and bond yields Indices view Stock market view Look Ahead Commodities Look ahead FX […]
1, Trump shock fails to ignite global market rout
After months of ruminations over what type of hell a Trump Presidency would unleash over financial markets, we finally got to see it in action on Wednesday. In truth, the immediate reaction – once Trump was declared the winner – was sanguine, with US stocks actually closing higher in the two days after the election, and the Dow Jones reached a fresh record high.
Perhaps markets believe that President Trump will be a different character once he is part of the establishment, perhaps they have taken the view that there’s only a limited amount of damage that a single President can initiate. Trump won’t be able to change US treaties or current laws overnight. Even with a Republican Congress his unity message during his victory speech last week suggests that he may not rush in to enact huge changes to the American society or economy.
As we move through this week, we will be watching closely to see President elect Trump’s first meeting with a foreign leader. He meets with Japanese Prime Minister Abe this week, at PM Abe’s request. Markets will be watching to see if relations are cordial between the two men, at this first test of Trump’s diplomatic skills. He is also likely to meet with his advisors, and could signal who will take up key roles in his administration. Establishment Republicans with a long record of governing are expected to feature heavily, which could go further to settle watchful markets.
With one maverick in the White House, the markets will hope no more will join him. Interestingly, the rebound in US stocks and the US dollar only came about during Trump’s victory speech when he struck a much more conciliatory and Presidential tone, leaving behind the controversial and divisive rhetoric from his campaign.
However, we remain on our guard. Is this stock market rally the real deal, or is it just skin deep, a sigh of relief that maybe Trump will make a decent President? However, we think it is wise to remain sceptical at this stage; Trump could still generate waves of uncertainty that may trigger spikes in volatility. The first test will be whom he chooses for his team, if he doesn’t pass with flying colours than the honeymoon period for stocks and the dollar, in particular, may be short-lived.
2, The Trump Presidency and bond yields
US Treasuries have fallen sharply in the days since Trump won the election. This is also a sign of a risk rally, since Treasuries are considered safe havens. However, the steep rise in bond yields (yields move inversely to price) in recent days suggests that the market could be anticipating a rise in inflation under Trump, which could have implications for the markets.
10-year Treasury yields have risen 44 basis points since Trump won the election, this is a huge move for Treasuries in a mere 48 hours. Rising bond yields, especially off such a low base, can be a sign of economic confidence, but in this instance there could be a few factors at play. 1, Trump announced an infrastructure plan in his victory speech on Tuesday night, this could mean more government borrowing to fund such a scheme, which is putting upward pressure on yields. 2, if government spending rises under Trump then this could be inflationary for the US economy. 3, during his campaign Trump said that he might consider defaulting on the US debt pile. We don’t think he will actually do anything so drastic as President, however, if bond yields continue to rise at this fast clip then it could be a sign that the US is less creditworthy under billionaire President Trump.
10-year Treasury yields are at their highest level since January. The yield was at 2.31% on December 3rd 2015, it was last at 3% in January 2014, but if yields continue to rise at their current pace, we could see this level sooner than we thought.
Another driver of rising bond yields has been growing expectations of a rate hike from the Federal Reserve. The market is pricing in an 80% probability of a hike from the Fed next month. Ahead of the election, some had assumed that the Fed might refrain from hiking rates if Trump won, however, now that Trump has sent a signal that he is happy to expand government spending and fiscal policy, this could free up the Fed to hike rates at an even faster pace than the market had previously anticipated. We will hear from Fed members Williams, Lacker and Kaplan this week, and will look for any clues about interest rates prospects in 2017.
This shift in bond yields could have a dramatic impact on financial markets. Already the rise in yields appears to be weighing on EM asset prices. Emerging markets are particularly sensitive to shifts in US interest rate expectations. Mexican and Brazilian stock markets had steep falls last week, while the Mexican peso is down more than 10% since the election, the South African rand and the Brazilian real have both fallen more than 6%. It appears that the EM financial environment has already reacted to the steep rise in bond yields.
As we start a new week we will be looking to see if other asset classes follow suit: could gold pick up once more, since it is considered a decent inflation hedge? Also, rising bond yields tend to have an inverse correlation to stocks (see the chart below). So, as yields rise, stocks can sell off. If bond yields continue to rise this week then it will be harder for stocks to extend their recent rallies.
Figure 1: A long-term chart showing how bond yields and stocks move in opposite directions over time. (10-year Treasury yields, white line, S&P 500, orange line).
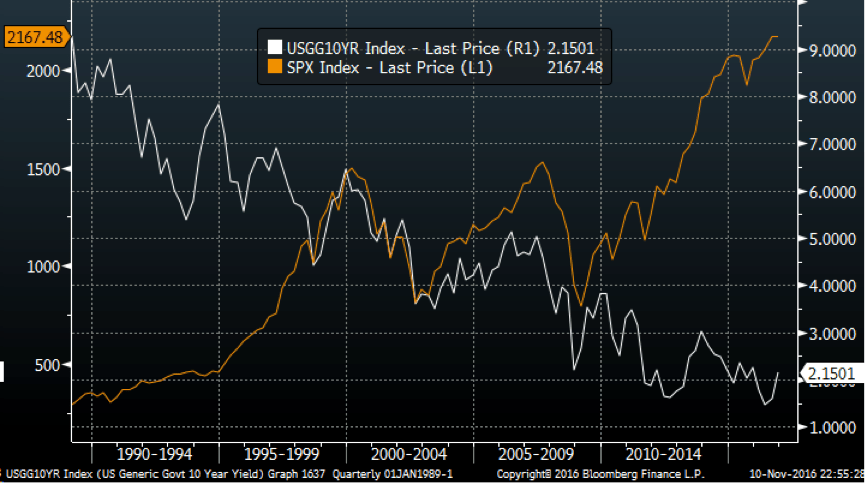
Source: City Index and Bloomberg
3, Indices Outlok: FTSE 100 consolidates as U.S. stocks sell off
Thursday’s FTSE 100 sell-off gives the lie to the notion that sentiment had stabilised in the wake of Wednesday’s Trump shock.
After an eerie calm a day ago, jitters are getting to investors on both sides of the Atlantic as major U.S. stock indices slide anew.
The VIX Volatility Index, AKA the ‘fear gauge’, also lived up to its name by swinging 11% into the black at the time of writing having extended Wednesday’s deep decline by 8% just hours before.
A broad and rekindled trepidation about the economic impact of a Trump administration also linked back to the FTSE’s own particular burden on Thursday: a sharp slide of British American Tobacco and Imperial Brands (formerly Imperial Tobacco).
In the same way that investors stateside had cooled to plans by AT&T to buy Time Warner for fear of regulatory snarl-ups, given Presidenelect Trump’s stated dislike of the deal, BAT’s proposed $47bn buy-out of Reynolds American also met with a more sceptical eye, sending BAT shares 6% lower.
Highly-rated gold miners, Anglo American and Fresnillo also fell, by around 11% apiece after a rebound of the metal’s price from monthly lows fizzled.
From a technical perspective, the FTSE’s consolidation of the post-Brexit vote recovery continues.
At the time of writing, it looked like the market was again attempting to fill what is essentially a gap from Wednesday’s volatile comeback.
So long as the thesis of its long-term rising trend is correct—short-lived breach in late-June aside—investors should only get really worried if the lower wall of its rising channel gives way.
In place since January this year, the closest point of entry to the FTSE’s current level is around 6707.
Figure 2:
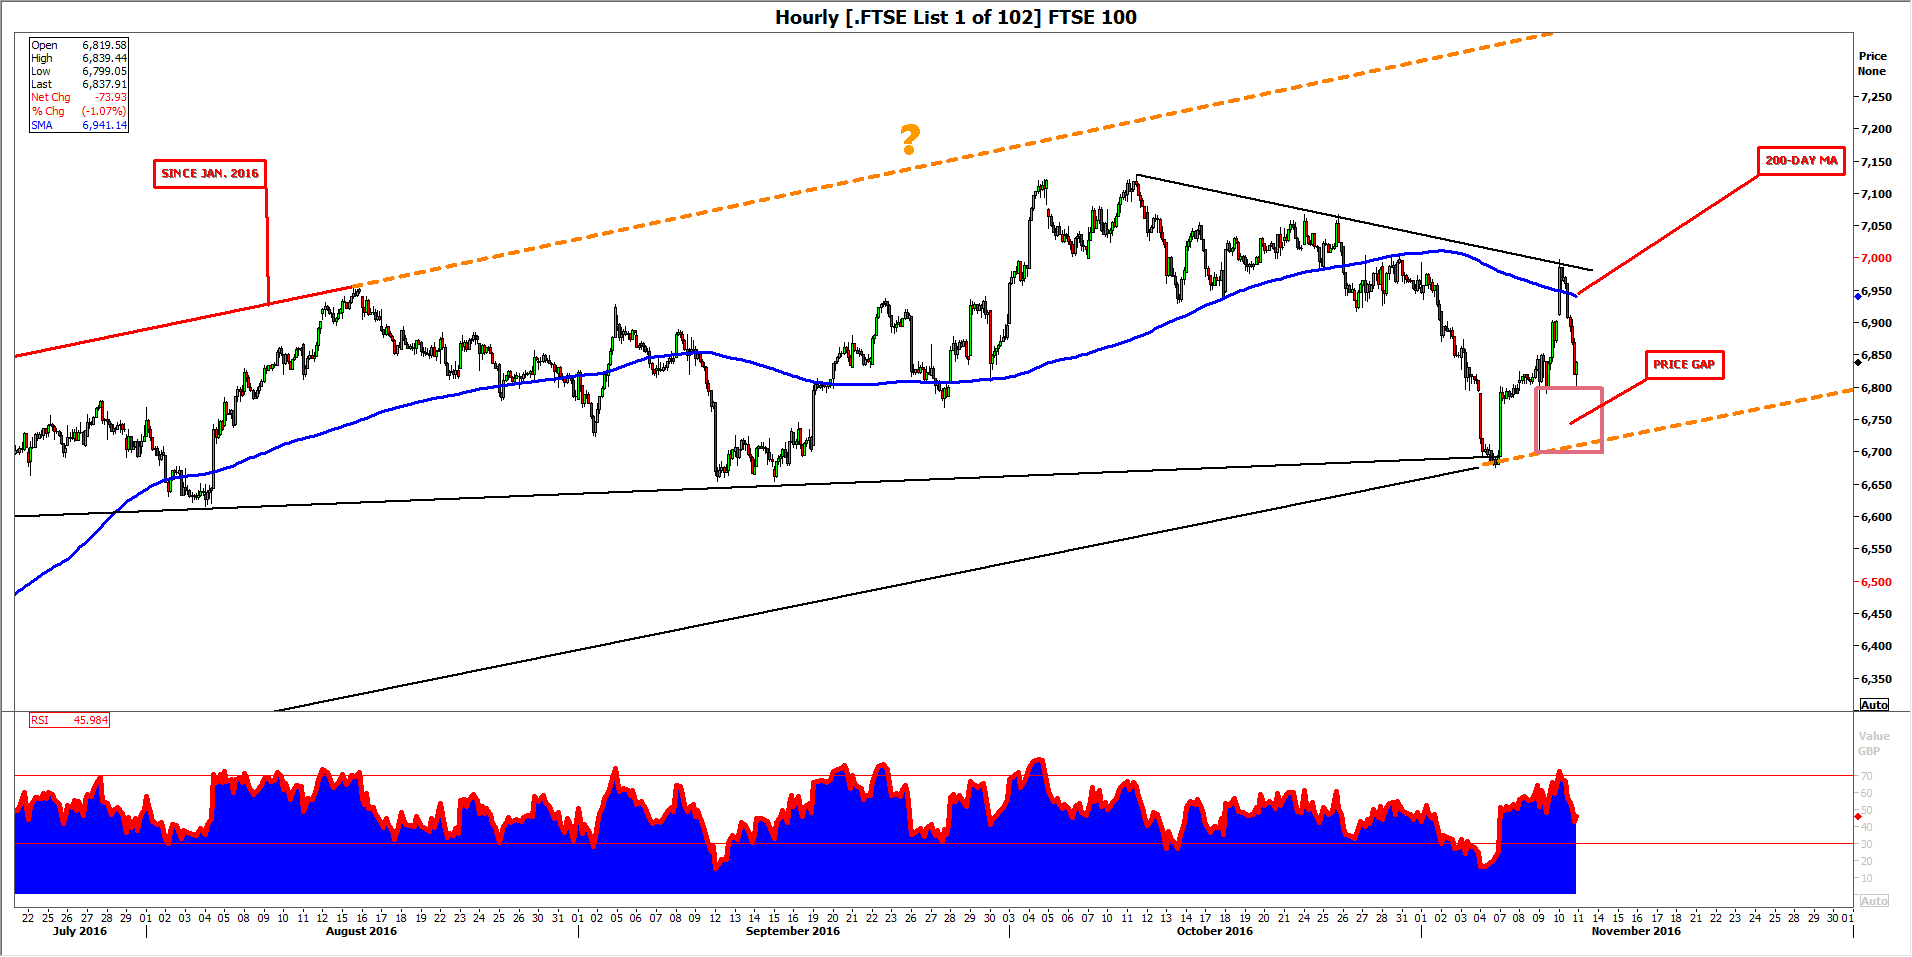
Source: City Index
4, Stock Outlook: VIX demand overshadows U.S. stocks bounce
U.S. investors are set to continue the remarkable rebound of risk seeking on Thursday, in the wake of Donald Trump’s election victory.
Stock futures are pointing higher after the biggest surge in Japan’s Nikkei in 9 months.
Swings of the VIX Volatility Index also typify the equities roundabout.
It careered 23% lower at one point on Wednesday, and was another 4% lower at the time of writing.
Investors have calmed considerably since their clear trepidation ahead of 8th November, and the intense but short-lived sell-off after Trump’s win.
But there are signs that investor calm may not run so deep.
A check of Wednesday’s tape a little into the session showed some 130,000 VIX puts traded vs. 229,000 calls, 3 and 4 times the seasonal average according to data from Trade Alert LLC.
Some of this influx fed an unmistakeable rise in bearish expectations into the year end and first few months of 2017.
At some 430,000 the count already dwarfs 250K outstanding late in December 2015.
Even excluding deep positioning with a pessimistic tinge in the rest November—2.3 million calls; 1.4 million puts—the closing days of the year skew unmistakeably bearish.
The last expiry of the year on Wednesday 21st December holds 1.3 million calls against 660,000 puts, with volume continuing to rise as I write.
Open interest is concentrated in Dec 21 calls—almost 800,000 bets eye VIX strikes between 20 and 30.
With the ‘fear gauge’ at 13.5 at the time of writing, call buyers are betting on a bounce of at least 48% by VIX futures sometime between now and 21st December.
Can you imagine the portentous note of tension this would strike over global stock markets?
It’s little surprise that investors took out more insurance against a market rout this December than in pre-Trump December 2015.
Also bear in mind that the VIX is neither a cause of volatility nor a good predictor of how long the craziness might last.
5, Commodities Outlook: Crude oil ready to bounce back?
Over the past several days, bearish speculators in Brent oil have had little success at pushing prices below $45.00. This is because we are in a range-bound market and oil prices have reached the lower end of the current range. Thus, we may see a rebound towards $50 or higher again, ahead of the OPEC meeting at the end of the month. Although there is so much doubt about the prospects of a production cut or freeze deal between the OPEC and Russia, an agreement is still possible. This will probably keep oil prices higher than would be the case if the markets were completely convinced that there will be no deal on oil production come the end of the month.
The area around $45.00 is where Brent had previously found strong support from. Here, we now also have the rising 200-day moving average coming into play. In addition, the momentum indicator RSI has started to move away from the “oversold” levels of 30 or lower. Thus, momentum appears to be with the buyers again. Indeed, after Wednesday’s sell-off, the failure of price to hold below the prior low of $45.15 clearly highlights the fact that the sellers are not willing to commit to those levels. While this could still turn out to be a false hope for bullish speculators, the bears should be taking no chances here as the trend since the beginning of this year has been more or less bullish, even if the break of the rising trend line means the strength of the trend has weakened.
Figure 4:
Source: City Index
6, FX Outlook: GBPUSD and USDJPY
GBP/USD
Despite the sharp rebound in the dollar in the day after the US elections, the GBP/USD managed to hold its own relatively well. The pound has also fared exceptionally well against the euro. Things actually started to turn positive for the beleaguered currency towards the end of last month. This was chiefly in response to the Bank of England’s decision to abandon its dovish bias after admitting that UK inflation could overshoot the 2% target, due to the currency’s recent slump. Added to this, news that the High Court ruled that the government must seek parliament’s approval before triggering Brexit Article 50 was also deemed pound-positive as this could delay Britain’s exit from the EU or potentially even stop it altogether. With the BoE now neutral and UK data remaining surprisingly strong despite these uncertain times for the UK, the pound could stage a more meaningful comeback. Meanwhile with Trump set to take over from Obama in the White House in January, the Federal Reserve may decide to wait until the first quarter of 2017 before raising rates again, although the markets appear to be about 80% confident that a rate rise will happen before the end of this year. If the Fed does delay raising rates, this could limit the dollar’s upside potential, which should in theory underpin the GBP/USD.
In the short-term, next week’s high-impact UK data – CPI, wages, employment and retail sales – could have a big say in the pound’s near-term direction while for the dollar it is also US CPI and retail sales among the highlights. Meanwhile from a technical point of view, things are starting to look a little bit brighter for the GBP/USD and recent price action suggests that a low may have been made around the 1.20s, though we are unlikely to see 1.40s or 1.50s any time soon. As can be seen on the 4-hour chart, below, the cable has already broken above its bearish trend line. It has also held above the broken resistance at 1.2350 and the rising 50-period moving average. So clearly, the short-term trend is currently bullish. This will change however if the 1.2350 support level gives way. Unless that happens, there is a good chance we will revisit the 1.25 psychological level, the recent swing highs around 1.2550 and the point of origin of the flash crash breakdown at 1.2600. A couple of other medium-term levels to watch include 1.2680/5 and then 1.2800.
Figure 4:
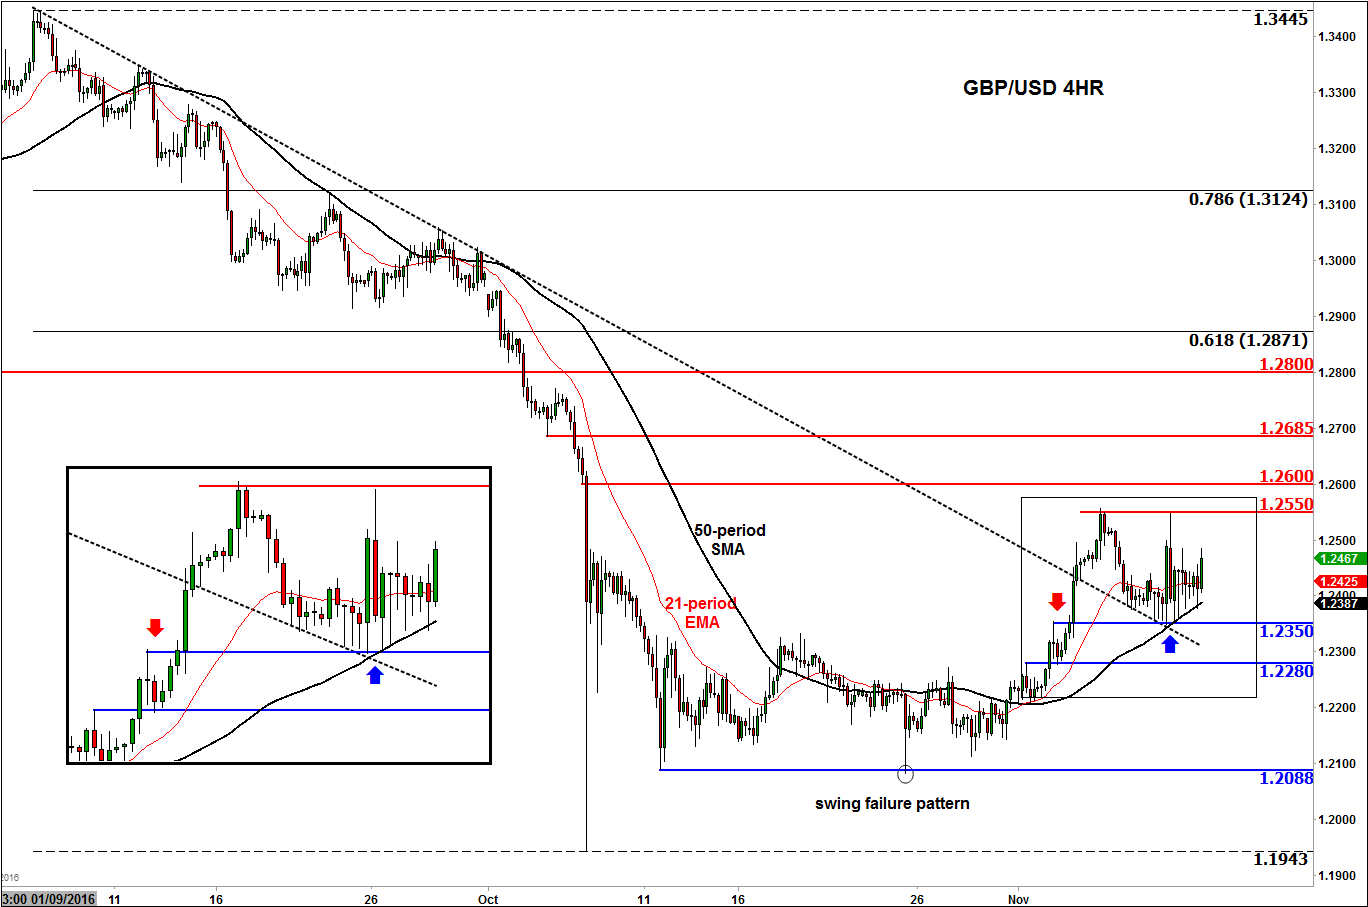
Source: City Index
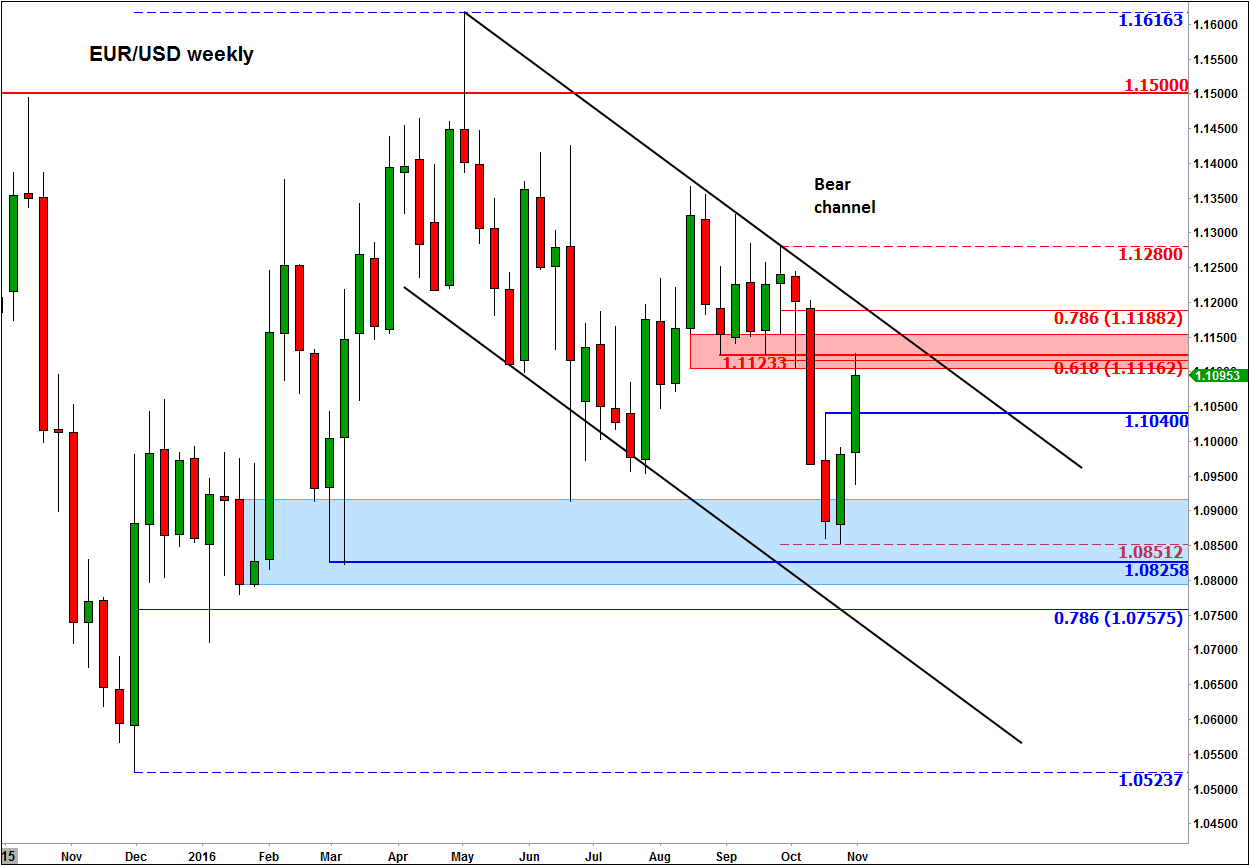
USD/JPY
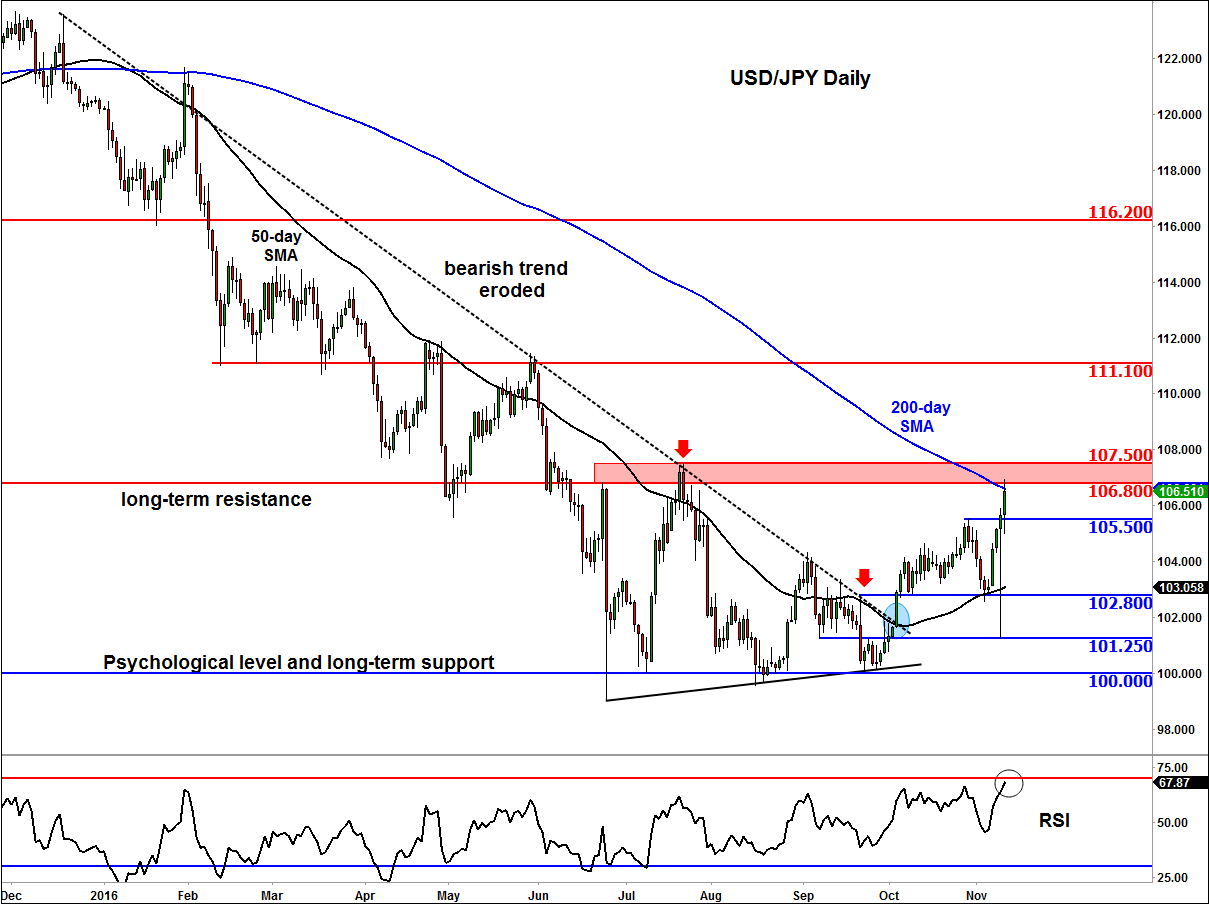
Following the v-shaped recovery on the back of Donald Trump’s victory in the US presidential race, the USD/JPY now finds itself hovering around a key technical area of between 106.80 and 107.50. This area was previously support and resistance and converges with the 200-day moving average. A rejection here would not come as a surprise to us. If so, the bears may target the 105.50 support level next and if that level breaks then we could see the onset of a much larger correction. Conversely, a breakout above 106.80/107.50 would be considered a major bullish development, in which case a continuation towards 111.00/10, the previous point of reference, could be a realistic bullish objective.
Figure 5:
Source: City Index