Wall St pauses as Trumpflation in the balance
Storm cloud’s gathering over President Donald Trump’s legislative agenda have triggered Wall Street’s biggest slide since October.
Storm cloud’s gathering over President Donald Trump’s legislative agenda have triggered Wall Street’s biggest slide since October.
Falls of more than 200 points and 1% respectively by key indices the Dow Jones Industrial Average and the S&P 500 are easily their biggest since the election.
Furthermore, the sell-off shows a clear rotation out of shares widely cast as beneficiaries of Trump’s legislative intentions. Large industrials and bank stocks are among the biggest losers. Bank of America was the biggest faller in the benchmark for much of Tuesday’s session, leading a tumbling financial sector after it surged 20% higher between the beginning of November and the end of 2016.
Bank stocks had sailed on the coat tails of benchmark U.S. borrowing costs. But in step with the greenback, the yield unwind that began with the Fed’s rate hike last week accelerated on Tuesday, sending US 10-year Treasury yields to their weakest rate since the beginning of the month as investors reverted to the more traditional pattern of seeking safety in gold, Treasurys and the yen. Benchmark 10-year yields fell as low as 2.4210%, the lowest since 1st March and sharply below a two-year peak above 2.64% in December.
The yen strengthened to the 111-yen handle per dollar extending earlier gains to as much as 0.7% and the strongest since the end of February. Meanwhile, gold, which has been robust since advancing in the wake of the Fed’s dovish hike last week, shone more definitively above $1,245/oz. eyeing the 38.2% retracement of the spot’s July-December decline. Infrastructure-related stocks like U.S. Steel and its rivals fell between 7%-9%. Shares of Caterpillar, the world’s largest maker of construction equipment by sales, fell 3%.
In short investors are signalling that they now view Trumpflation as in the balance
The main triggers for Tuesday’s stock market sell-off include the FBI’s unprecedented confirmation that it’s investigating possible collusion between Trump’s election campaign and Russia.
The main worry among investors is that the discovery of implicating information might bring a possibly ‘fatal’ loss of standing on Capitol Hill for the Trump administration. It was notable that cable television channels on Monday devoted more broadcast hours to statements by FBI director James Comey and National Security Agency head Michael Rogers than to the first congressional hearing for Neil Gorsuch, Trump’s Supreme Court nominee, who appears to be widely respected on both sides of the House.
The market’s slide also precedes expected efforts by the Republican Party to move controversial legislation on Obamacare reform to the House floor for debate, perhaps as early as Thursday. Political strategists calculate that the GOP can afford to lose no more than 20 votes from its own ranks or the bill will fail. Democrats are almost unanimously against the reforms.
The risk of such an embarrassing failure—which could reduce Trump’s chances of successfully pushing through plans like tax reform— has triggered a rush by investors to the sidelines.
A sell-off of this kind has been in the works for some months. Momentum readings for major U.S. equity gauges have been sounding alarm bells as early as November.
In fact, the widely used moving average convergence divergence (MACD) tool—which gauges the strength of underlying trends and helps predict reversals—recently reached levels that almost matched the second-highest since 1999, on an annual basis, as shown in the chart below. This serves to confirm widely held views that U.S. markets had become overbought to near-historic levels.
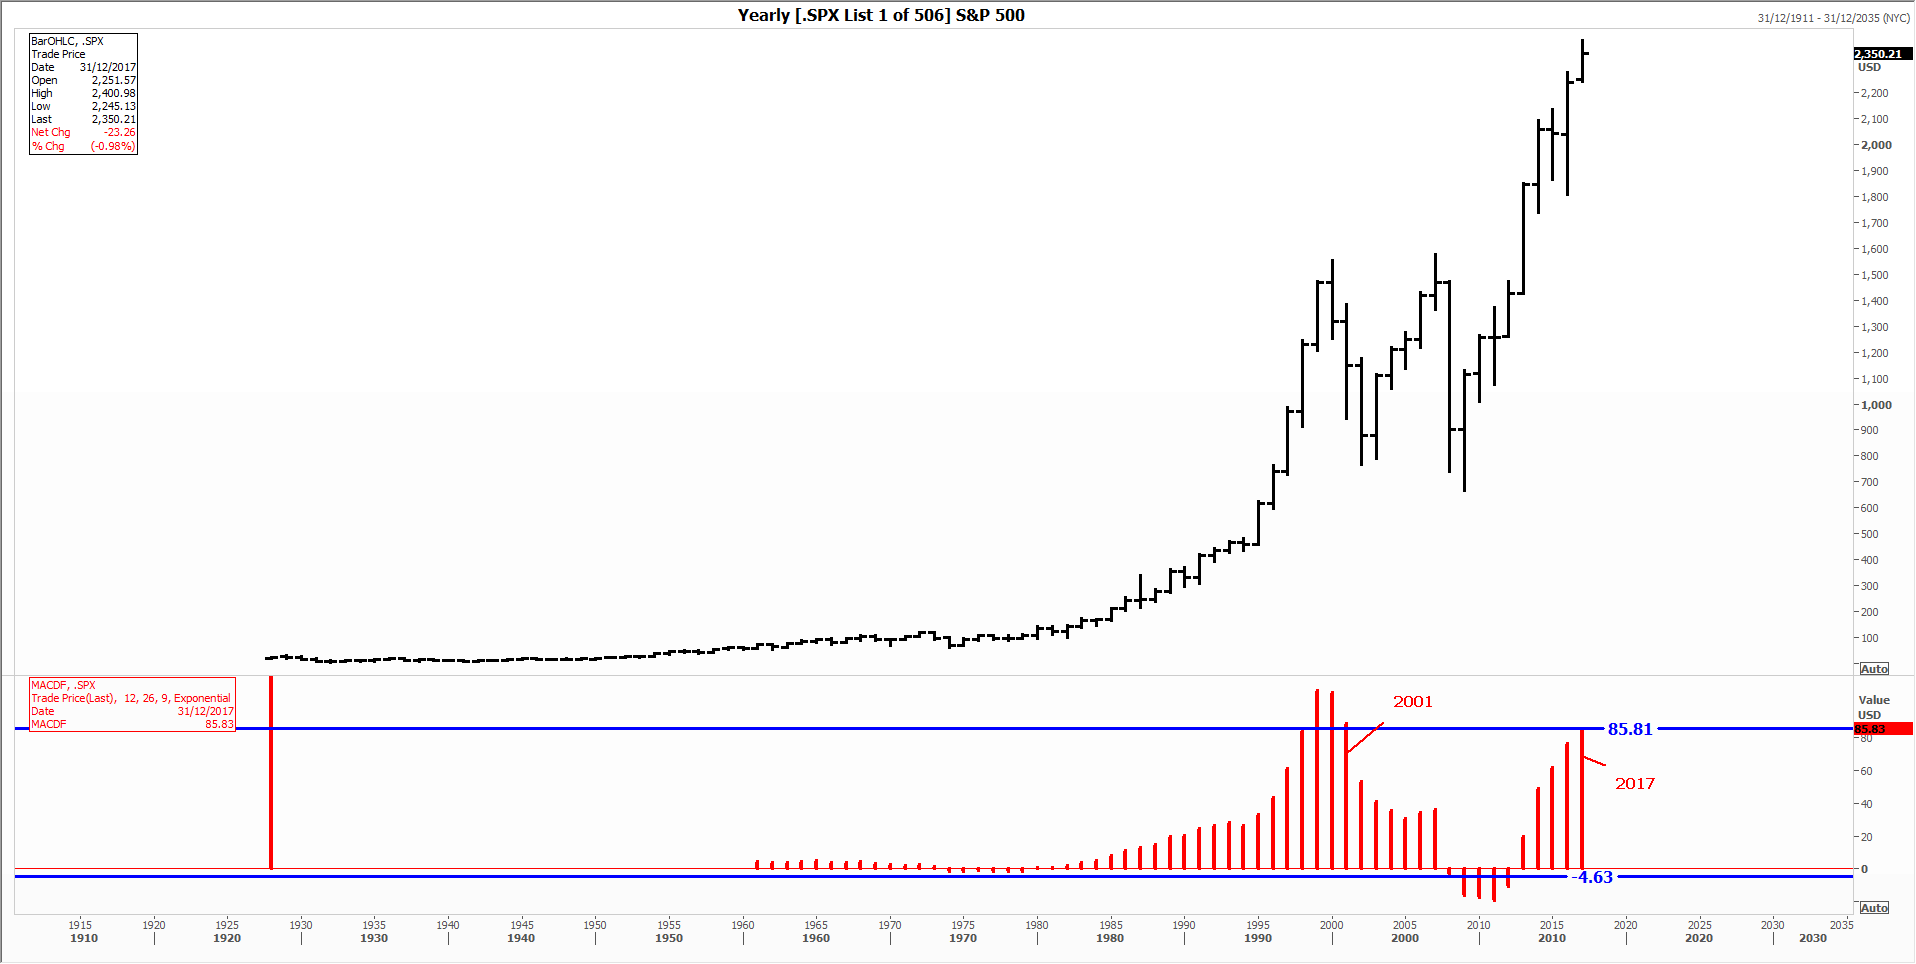
Source: Thomson Reuters, City Index
In the meantime, volatility indicators like the VIX index have been crushed and capped for months, not too far from all-time lows. This helped the market avoid a fall of 1% or more for 109 days up till last night’s close. That’s the longest it has gone without such a slide since 1995, when it went for a record 110 days without falling 1% or more. At the end of such a strong run we might suppose that a spigot for selling might well have been opened, and that a sell-off could extend Tuesday’s slippage significantly.
However, other trading records suggest that the game for S&P 500 bulls is not yet up. So far, the S&P 500’S reversal seems rather shallow. Traders will note that the S&P 500’s 2% odd fall over 14 days is too shallow and slow to represent the inverse of the market’s run higher.
Additionally, a pull back of the dollar that has pushed the Dollar Index below the 100 level for the first time since the end of January, if sustained, can be expected to attract buyers to shares of large U.S. exporters. If seen, the sell-off is likely to be short-lived.
The correction could yet pick up steam and momentum could well overshoot on the downside from here as noted above. Further damaging revelations from the Federal probe into Trump and his associates could do the trick, as might a decisive rejection over the next few days of healthcare reform on Capitol Hill.
