


Medium-term technical outlook on Visa (V)
click to enlarge charts
Key Levels (1 to 3 weeks)
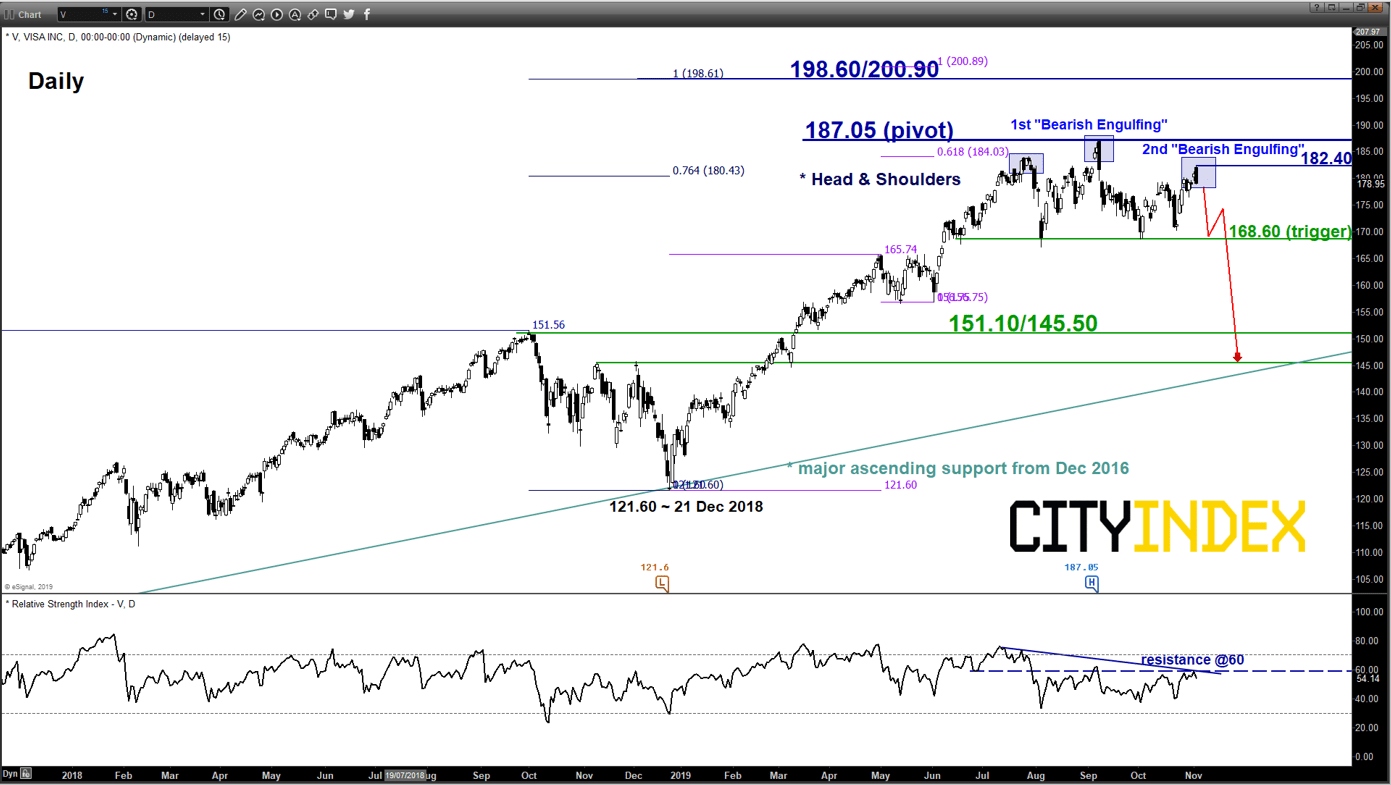
Intermediate resistance: 182.40
Pivot (key resistance): 187.05
Supports: 168.60 & 151.10/145.50
Next resistance: 198.60/200.90
Directional Bias (1 to 3 weeks)
A potential major 3-month toppish configuration in place since 29 Jul 2019, bearish bias below 187.05 pivotal resistance and a break below 168.60 is likely to reinforce the start of a potential corrective decline to target the next medium-term support zone at 151.10/145.50.
On the other hand, a clearance with a daily close above 187.05 sees an extension of the impulsive upleg sequence towards 198.60/200.90 next (Fibonacci expansion cluster).
Key elements
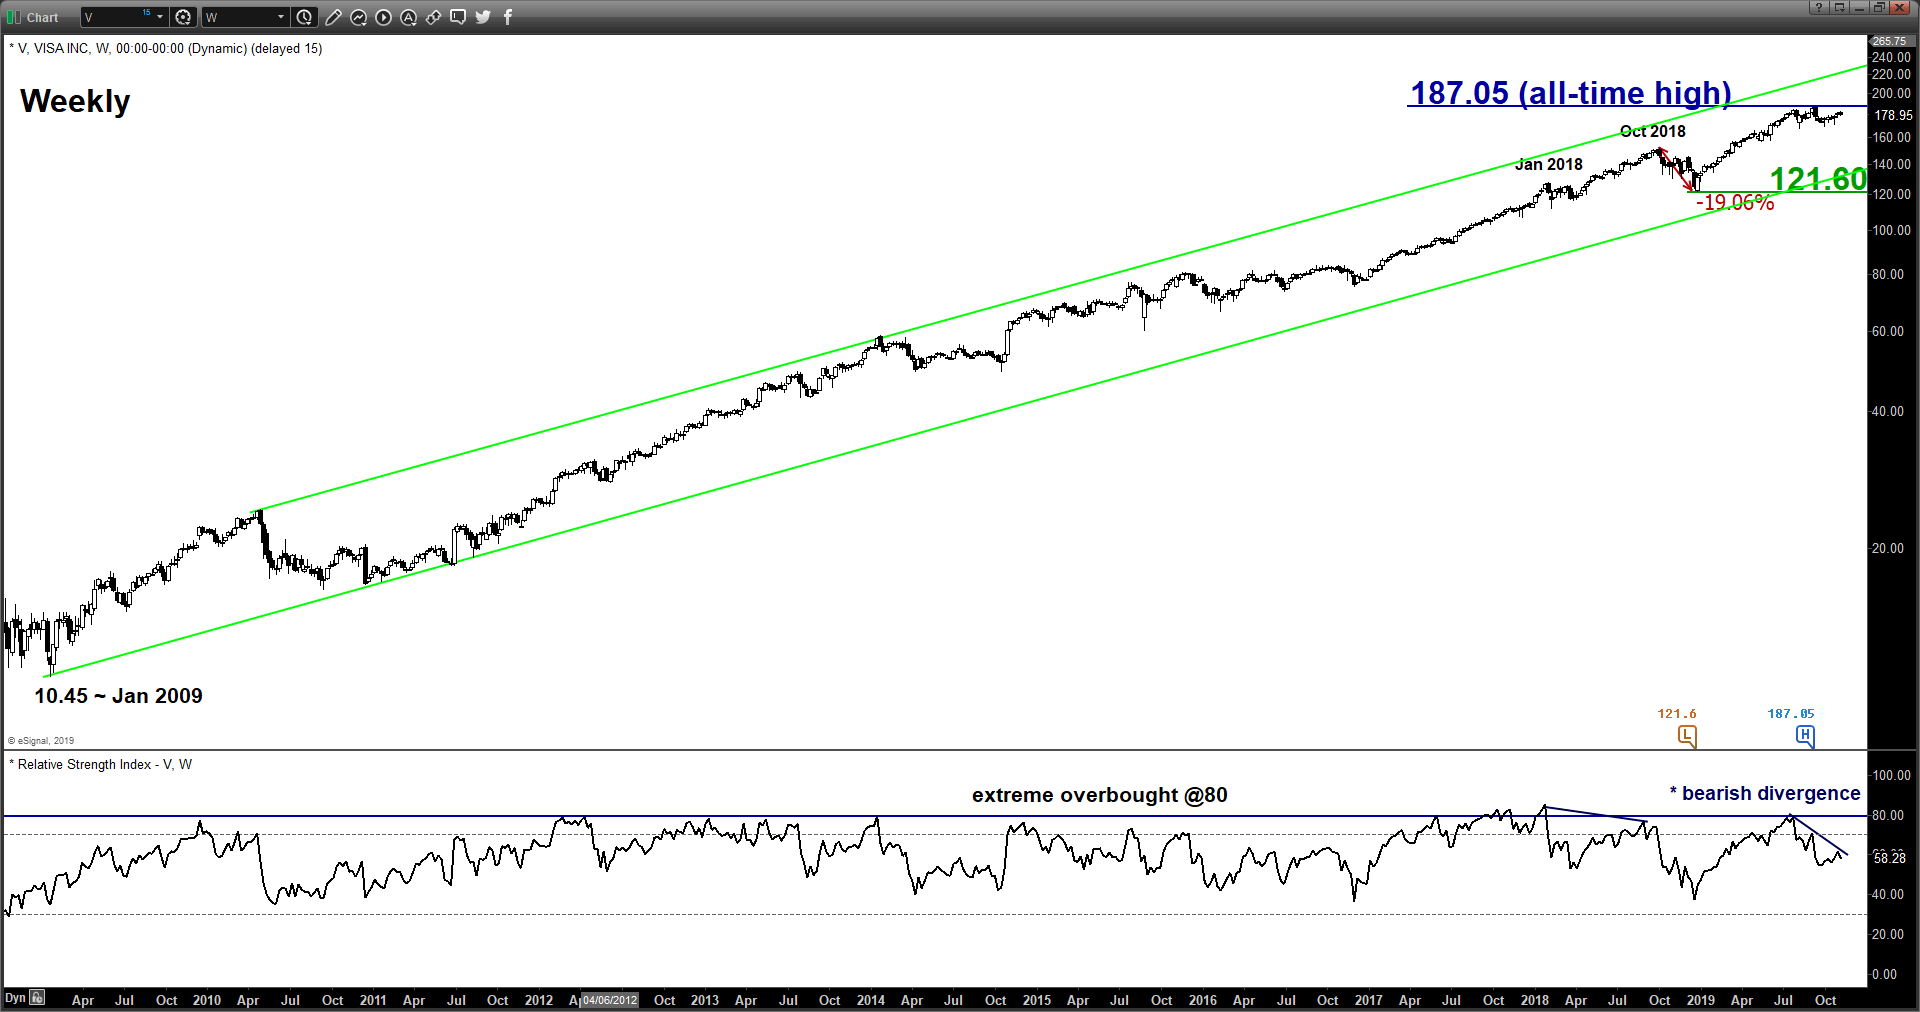
- The weekly RSI oscillator has continued to trace out a bearish divergence signal in place since its all-time high of 187.05 printed in Sep 2019 which indicates a slow- down in upside momentum of the major uptrend from 21 Dec 2018 low.
- A potential major bearish reversal “Head & Shoulders” configuration has started to take form since 29 Jul 2019 with its neckline support at 168.60.
- At the close of yesterday, 04 Nov U.S. session, the price action has formed a 2nd “Bearish Engulfing” candlestick pattern where the 1st Bearish Engulfing” has taken shaped at the 187.05 all-time high level. These observations suggest that sentiment has turned negative where a potential downside reversal in price action is imminent. Interestingly, the 2nd Bearish Engulfing candlestick pattern has formed at the “right shoulder” of the potential “Head & Shoulders” configuration with 1st Bearish Engulfing that has coincided with the “head”.
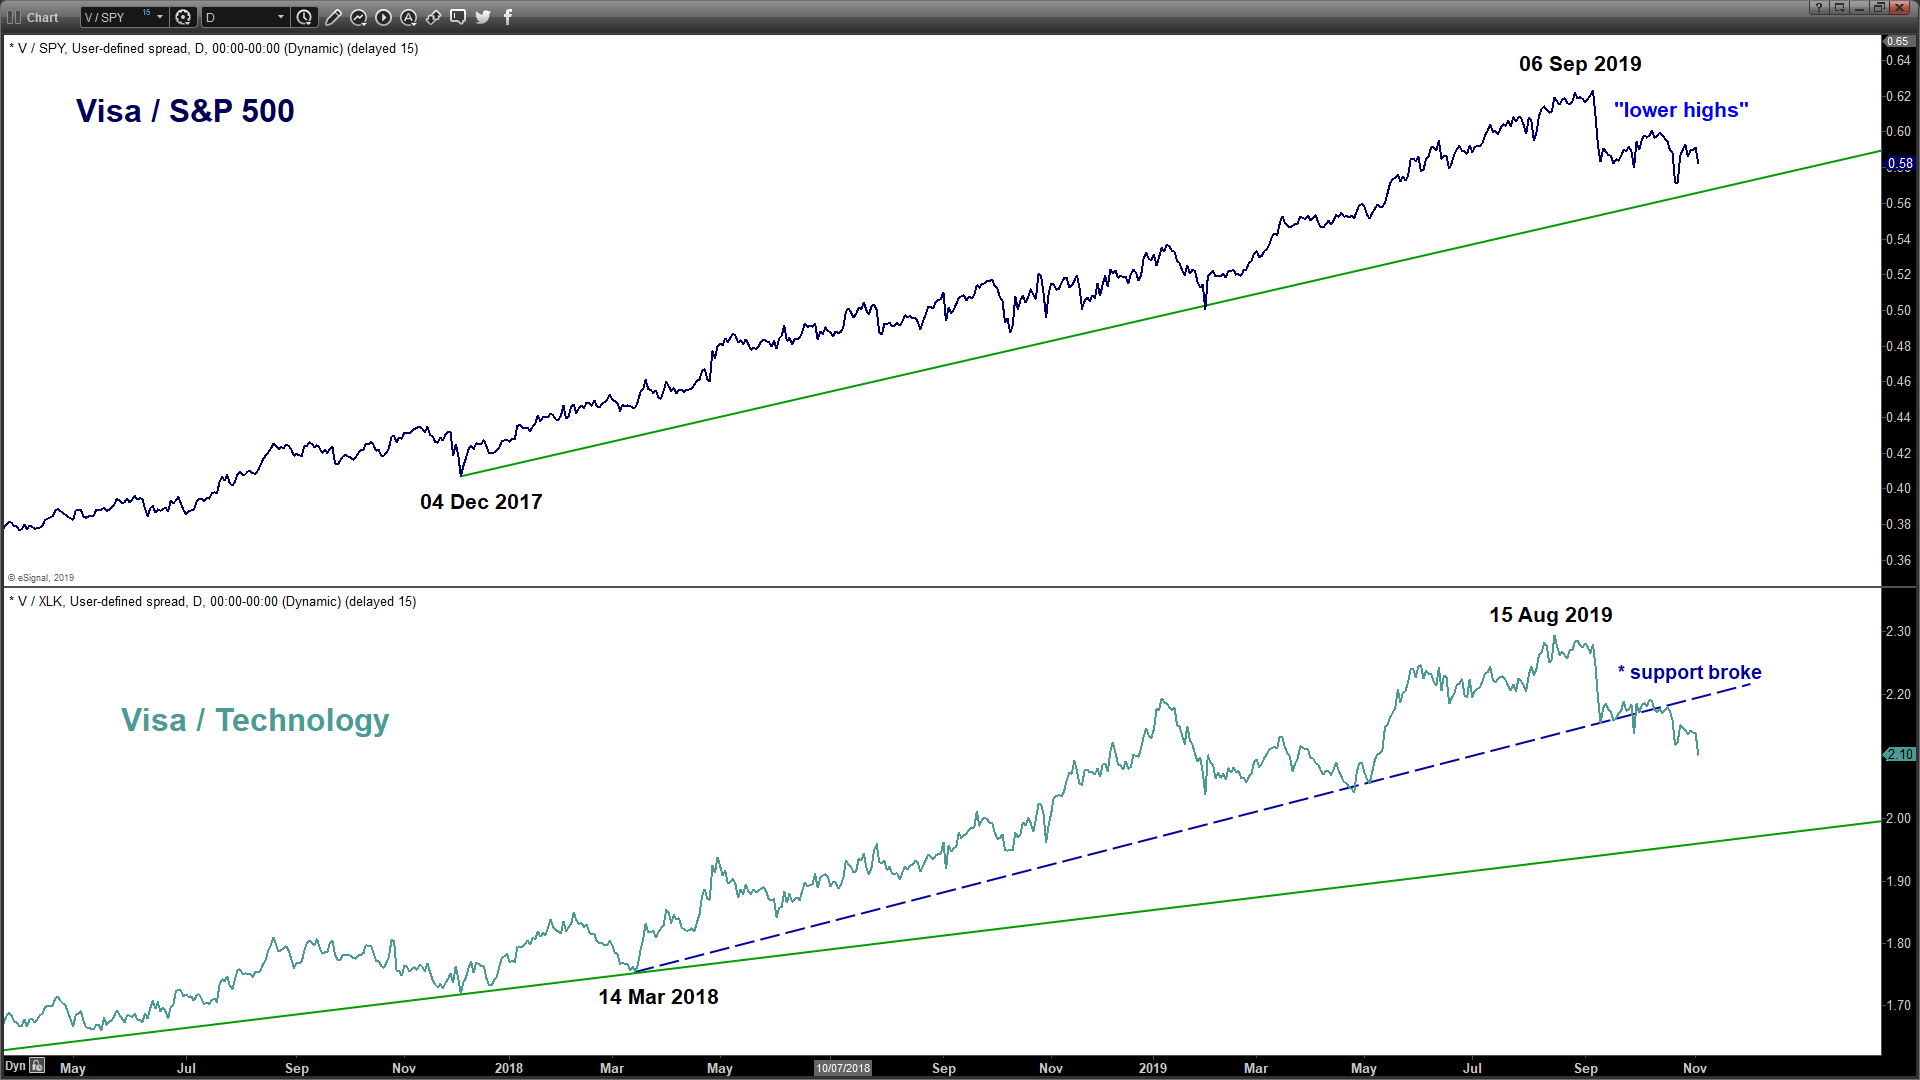
- Relative strength analysis as seen from the ratio charts of Visa against the market (S&P 500) and its sector (Technology) has indicated on-going underperformance of Visa.
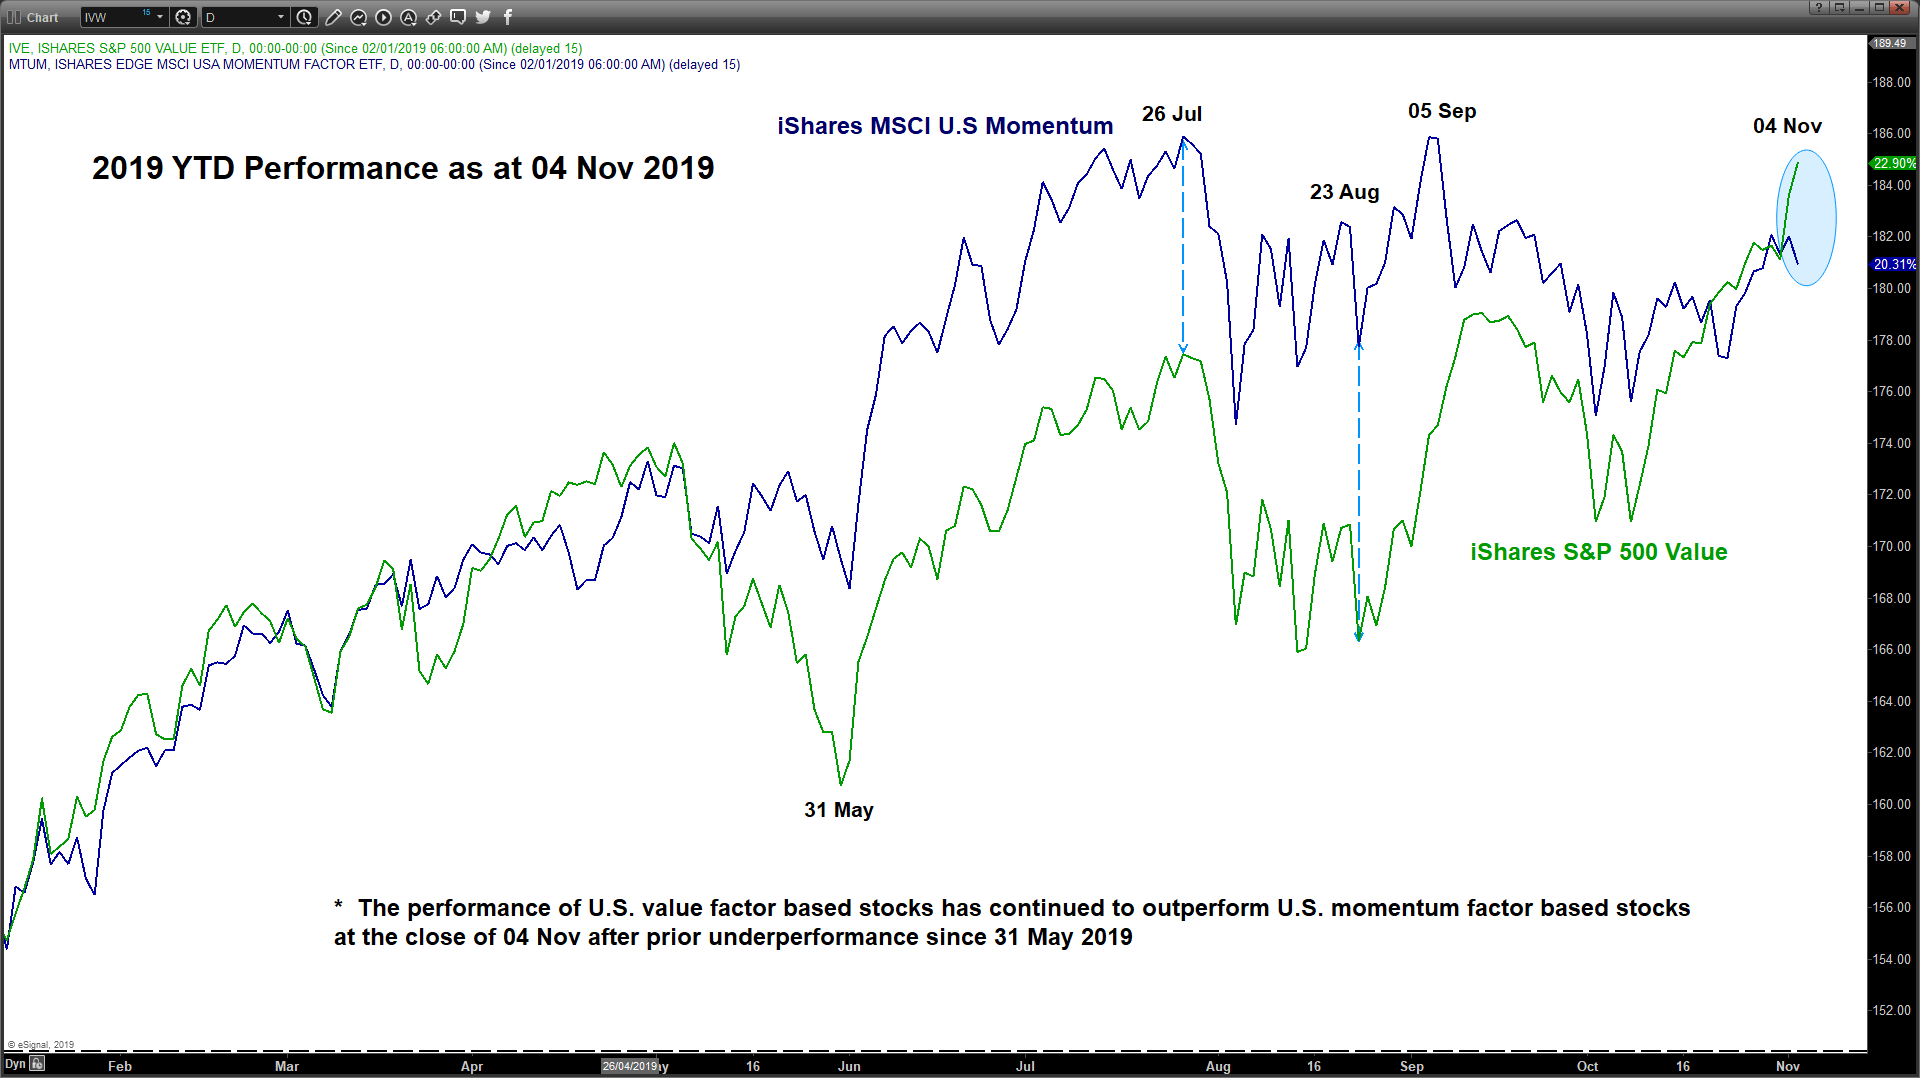
- Also, Visa is classified as a momentum factor-based stock where it is a significant component stock (4th largest) in the iShares USA Momentum Factor ETF that has underperformed against a basket of value factor-based stocks (iShares S&P 500 Value Factor ETF).
Charts are from eSignal
Latest market news
Yesterday 03:30 PM
Yesterday 01:23 PM
Yesterday 11:00 AM
Yesterday 08:15 AM
Latest Wall Street articles
August 8, 2023 09:54 AM
July 26, 2022 03:39 AM
June 30, 2022 08:10 AM
June 22, 2022 02:56 AM