


October 7, 2019 5:41 PM
USD/TRY Launches Out of Descending Wedge
Last Thursday, Turkey’s inflation data came out much worse than expected at 9.26% vs 15.51% expected and 15.01% last. With this drop in inflation, we discussed the possibility of USD/TRY breaking out of descending wedge on a 240-minute timeframe. Today, price not only broke out of the descending wedge, but also broke out of a symmetrical triangle on the daily timeframe, which USD/TRY has been in since August 2018. Price gapped higher on the open and is up over 2.5% on the day.
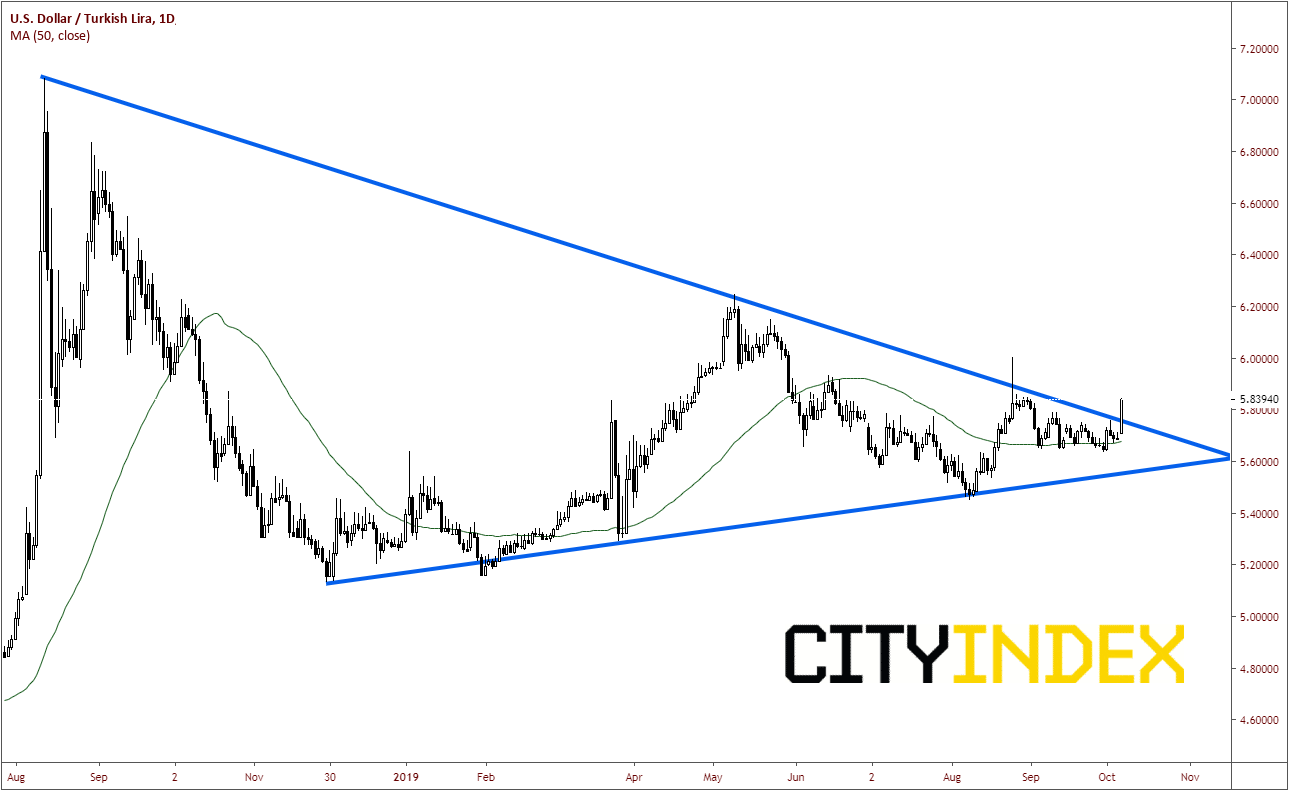
Source: Tradingview, City Index
Over the weekend, President Trump made a decision to pull US forces out of northeastern Syria. Today President Trump defended his decision, which makes it possible for Turkey to launch an attack on Kurdish fighters. The Turkish Lira was hit hard, and USD/TRY continued higher throughout the day.
The target for the breakout of a descending wedge is a retracement of the whole wedge. Now that price has broken through the 50% Fibonacci retracement level from the August 26th September 30th at 5.8206, the top of the descending wedge is in sight near 5.85. There is a strong resistance zone there, from 5.8500 to 5.8635, which is the 61.8% Fibonacci retracement level from the previously mentioned dates. If price breaks through there, it may tear up to 6.00, the spike highs from August 26th. First support is at the highs if the false breakout from October 2nd at 5.7575. Below that, the next support level is the gap from overnight down to 5.6978.
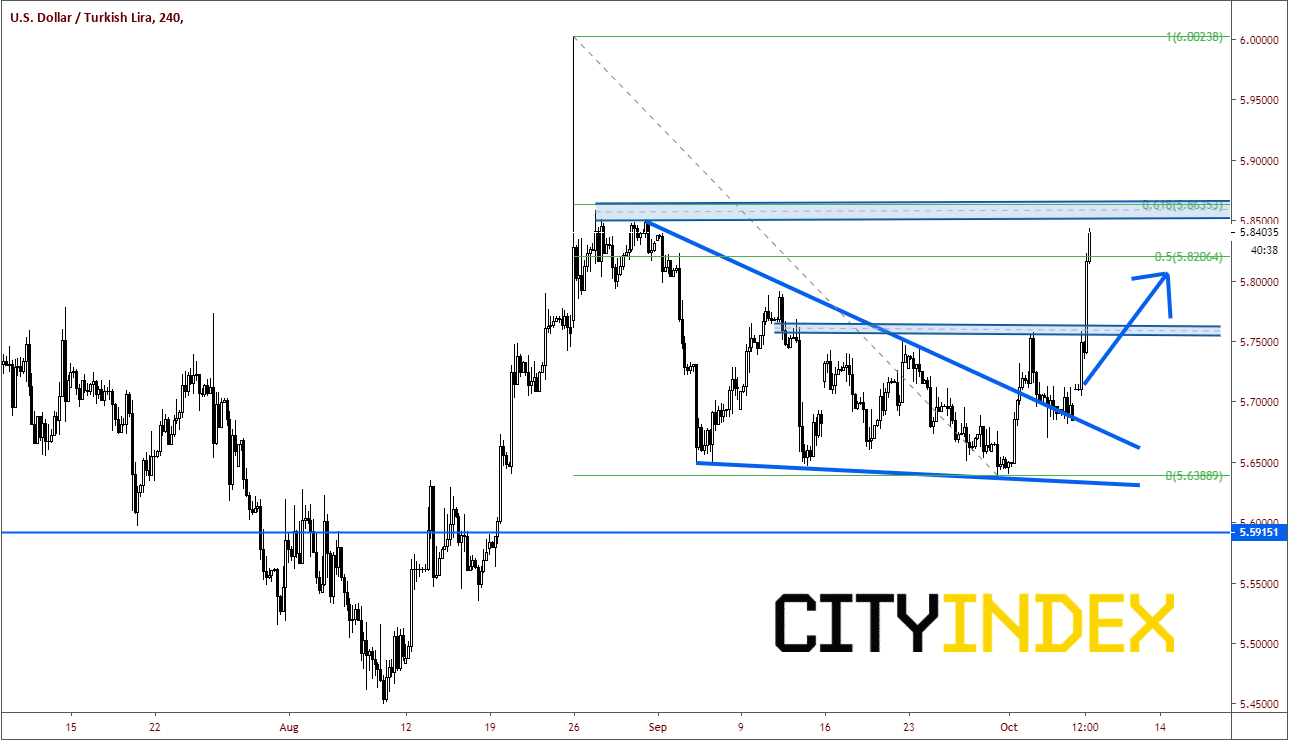
Source: Tradingview, City Index
Watch for more comments from public officials, tweets from Trump regarding the situation, or military escalations in the area to determine the next direction for USD/TRY.
Latest market news
Latest Dollar articles
Yesterday 06:20 AM
February 16, 2024 11:30 AM
February 7, 2024 03:30 PM
February 2, 2024 02:00 PM