USDCHF Possible Bullish Breakout on the Horizon
The US Dollar, as is its wont, has reversed back to the topside to erase this morning’s losses. The “comeback in the greenback” can be […]
The US Dollar, as is its wont, has reversed back to the topside to erase this morning’s losses. The “comeback in the greenback” can be […]
The US Dollar, as is its wont, has reversed back to the topside to erase this morning’s losses. The “comeback in the greenback” can be chalked up primarily to perspective: after the big dollar-negative reaction to yesterday’s slightly-less-hawkish-than-expected Federal Reserve meeting, traders are taking a step back to realize that not much has changed in the grand scheme of things. After all, the FOMC still expects to raise interest rates at some point this year, with a majority of committee members still anticipating at least two increases by year-end. Though the longer-term path of expected interest rates has been revised lower, the central bank still expects to hike rates consistently over the next few years, making it one of the only G10 central banks with tightening bias.
Beyond a clearer understanding of the Fed’s decision, the dollar was also supported by safe-haven flows on the lack of a breakthrough deal on Greece’s debt in today’s now-concluded Eurogroup meeting, as well as a stronger-than-anticipated Philly Fed Manufacturing report earlier in today’s US session. This confluence of proximate causes has taken the trade-weighted US dollar index back above the 94.00 level and created a number of daily reversal candles in individual USD-based pairs.
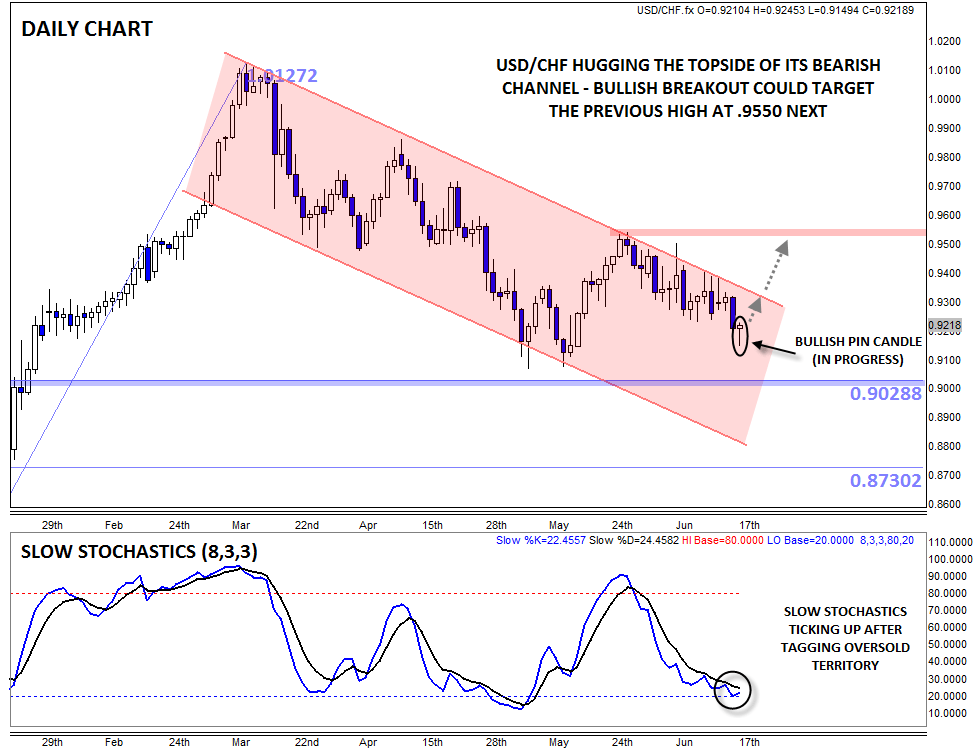
One particularly interesting development is in USDCHF. “Swissie” has been pressing against the top of its 3-month bearish channel for three full weeks now, and though it pulled back from that resistance level after the FOMC yesterday, today is shaping up as a potential reversal signal. We still have a few more hours before the end of the trading day, but USDCHF is currently showing a Bullish Pin*, or Hammer, candle on the daily chart, highlighting the aforementioned intraday shift from selling to buying pressure. Combined with the oversold reading in the Slow Stochastics indicator, there is a compelling technical case for a return back to the top of the channel above .9300.
More broadly, the recent price action is characteristic of a weakening downtrend. In a healthy bearish trend, a market will regularly oscillate between the top and bottom of descending channel (or in particularly strong trends, even break below the bottom of the channel). By contrast, USDCHF has been clinging to the top of its channel since late May, signaling that bulls are trying accumulate the pair on any short-term dips and that the descending channel could be vulnerable to a potential bullish breakout.
As always, price is the most important indicator at the end of the day, and the “price” (exchange rate) of USDCHF is still putting in lower lows and lower highs, the textbook definition of a downtrend. If we do see a bullish breakout, the next level to watch may be the previous high near .9550. To the downside, support sits near the previous lows at .9100 and the 61.8% Fibonacci retracement at .9030.
* A Bullish Pin (Pinnochio) candle, also known as a hammer or paper umbrella, is formed when prices fall within the candle before buyers step in and push prices back up to close near the open. It suggests the potential for a bullish continuation if the high of the candle is broken.