Global traders remain hyper-focused on the latest Greece-related rhetoric from such powerful luminaries as Latvia’s Central Bank Governor, Lithuania’s Finance Minister, and even the Finance Minister of Malta, but perhaps investors should be focusing just as much energy on the collapse in the price of …energy.
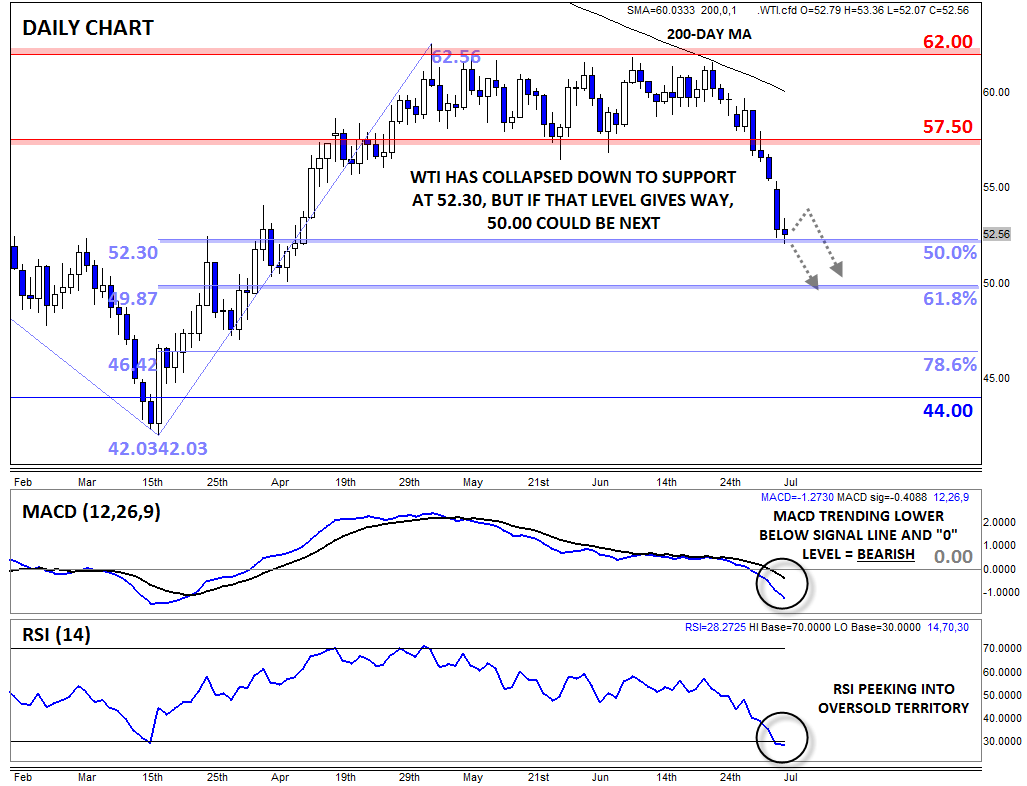
In particular, oil has gone off the boil, with WTI falling nearly 8% in yesterday’s trade alone. Beyond an last week’s surprising increase in US oil rigs and the ongoing Greek debt drama, the primary catalyst for the drop in oil has been optimism about a nuclear deal with Iran that could eventually bring up to 1 million barrels per day of the country’s oil back to the global market. Over the weekend, Russia’s Foreign Minister said that a deal with Iran “is about 90%” complete and suggested that the remaining issues were more procedural than political.
Combined with last week’s technical breakdown below 57.00, traders took these comments as a green light to drive WTI down to a low near 52.00 so far. “Black gold” is now testing the 50% Fibonacci retracement of its entire Q2 rally at 52.30, but if that level gives way, a continuation down toward the 61.8% retracement near the psychologically-significant $50 level could be next.
 Source: City Index
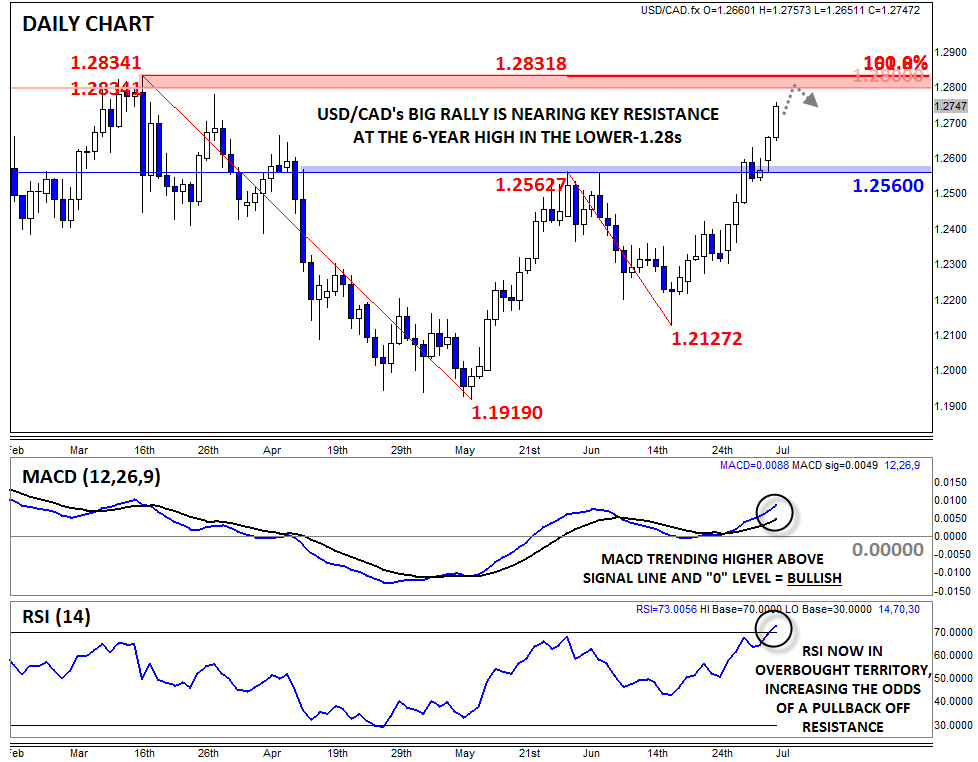
Not surprisingly, oil’s implosion has had a big impact on the currencies of oil-dependent economies; The Norwegian krone has fallen to a 3-month low against the greenback (and is within striking distance of its 13-year low), the Russian ruble has turned lower, and the Canadian dollar is quietly making a run toward its 6-year low against the US dollar. In fact, USDCAD has surged nearly 5% over the last three weeks, and bulls are now training their sights on a critical confluence of resistance in the lower-1.28s, where the late January high (1.2799), the mid-March high (1.2834) and the 161.8% Fibonacci extension of the June pullback (1.2832) all converge.
Meanwhile, USDCAD’s daily MACD indicator is trending consistently higher, signaling clear bullish momentum, though the RSI indicator is now in oversold territory, raising the probability of a pullback if and when that level is hit. Until then though, bulls will maintain the upper hand as long as USDCAD holds above previous-resistance-turned-support and this week’s low at 1.2560.
 Source: City Index