USD significant breakout looks imminent
The dollar remains in a strong bullish trend due to growing speculation over a September or December Federal Reserve rate hike, which would be the […]
The dollar remains in a strong bullish trend due to growing speculation over a September or December Federal Reserve rate hike, which would be the […]
The dollar remains in a strong bullish trend due to growing speculation over a September or December Federal Reserve rate hike, which would be the first in nine years, and dovish central banks elsewhere.
Indeed, the Fed’s Lockhart has given the clearest signal yet that he would vote to hike interest rates in September; only a significant deterioration in the data would convince him to think otherwise. Today’s mixed US economic numbers are unlikely to change his view.
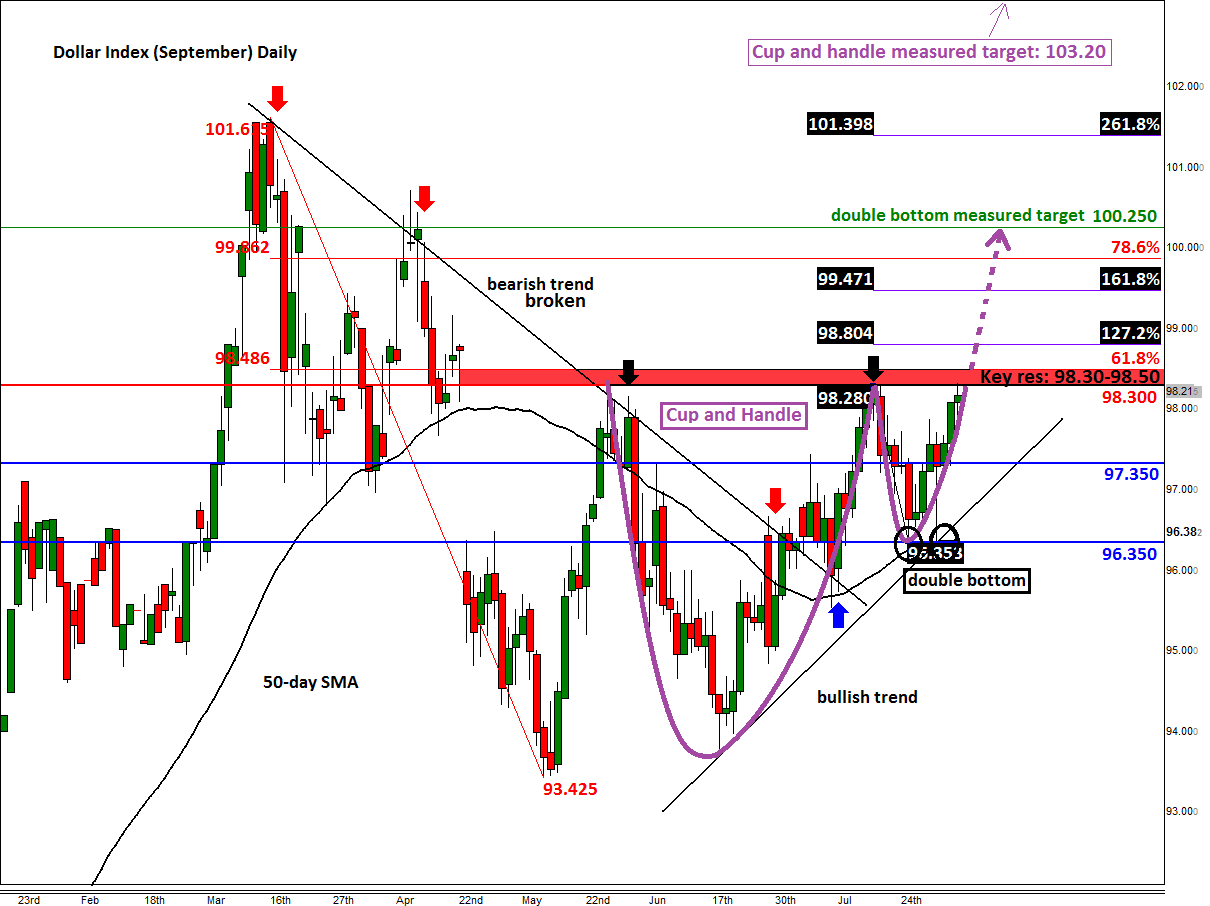
If the USD continues to respond favourably to the US macro numbers then a breakout could be on for several USD pairs, such as the USD/JPY above 124.50 and EUR/USD below 1.0820. The dollar index meanwhile is also on the verge of a breakout. As can be seen from the chart, the index has already broken above a bearish trend line and is holding comfortably above its 50-day moving average. More importantly, it has formed a double bottom reversal pattern at 96.35 and is inside a larger Cup and Handle continuation pattern. Even more importantly, it looks like it wants to break higher now as it is currently testing the key resistance area of 98.30-98.50.
The lower end of the abovementioned range is the horizontal resistance level that has provided a ceiling to prices for a good three months, while the upper end corresponds with the 61.8% Fibonacci retracement level of the downswing from the March peak. Therefore a decisive break above this range could lead to a significant rally. For short-term traders, the Fibonacci extension levels at 98.80 (127.2%) and 99.45 (161.8%) would be highly relevant. But the potential rally could extend beyond these levels over time, possibly towards 99.85 (78.6% retracement of the larger downswing) and 101.40 (261.8% extension of the short-term swing).
Meanwhile the measured double bottom target is 25 pips above the psychologically-important level of 100, at 100.25, while the target for the Cup and Handle is all the way up at 103.20. To get to these levels will need to see some solid US numbers now.
The key support levels level to watch are at 97.35 and then 100 pips lower at 96.35 – a potential break below the latter would be a very bearish outcome. A bullish trend line also goes through these levels.