USD MXN bears need a Peso maker after this year s start
As we’ve noted repeatedly over the first trading week, emerging market currencies have been getting walloped as panicked FX traders sell any holdings they see […]
As we’ve noted repeatedly over the first trading week, emerging market currencies have been getting walloped as panicked FX traders sell any holdings they see […]
As we’ve noted repeatedly over the first trading week, emerging market currencies have been getting walloped as panicked FX traders sell any holdings they see as risky for the perceived safety of the US dollar and Japanese yen. As the chart at the bottom of this report shows, the Mexican peso has certainly not been spared from the EM FX massacre.
Despite its close ties with the “best house in a bad neighborhood” US economy, Mexico’s economy has downshifted to a much slower pace of growth than we throughout the first half of last year. So far this year, peso traders have be “treated” to a series of lackluster data points south of the border:
Combined with the ongoing turmoil in China and falling commodity prices, it’s not surprising that peso bulls have been spooked out of their positions. While the country’s close trade ties with the US economy could cushion the impact of a major global slowdown, the peso still seems poised for more weakness against the world’s reserve currency on a fundamental basis.
Technical View: USD/MXN
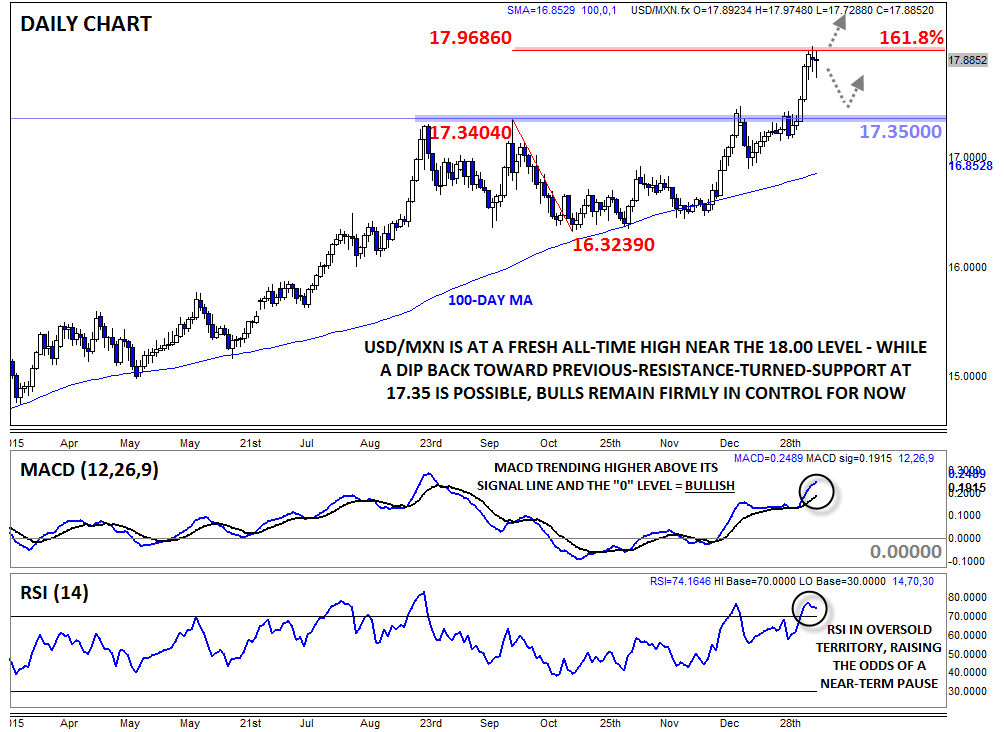
The chart is not any prettier for USD/MXN bears. USD/MXN trended consistently higher throughout all of last year, before breaking out above previous resistance in the 17.35 zone to a new all-time high last week. It’s been almost 18 months since the pair traded meaningfully below its 100-day MA, the hallmark of a consistent bullish trend.
At this point, the secondary indicators are showing exactly what you’d expect: the lagging MACD indicator shows strong and growing bullish momentum, though the RSI indicator is in overbought territory raising the chance of a near-term pause.
Moving forward, we would expect the previous resistance level at 17.35 to provide support on any near-term dips, followed by the 100-day MA near 16.85 if the 17.35 floor is broken. To the topside, there are no previous levels of resistance, though the near-term 161.8% Fibonacci extension at 17.96, followed by the same Fibonacci extension of the 2009-2011 pullback at 18.10 (not shown).
As always, the trend is the traders’ friend and it’s hard to argue that the trend in USD/MXN points anywhere but up.