USD JPY tightens consolidation poised for breakout
USD/JPY (daily chart) has further tightened the narrowing consolidation that has been in place for the past five months since the multi-year high of 103.72 […]
USD/JPY (daily chart) has further tightened the narrowing consolidation that has been in place for the past five months since the multi-year high of 103.72 […]
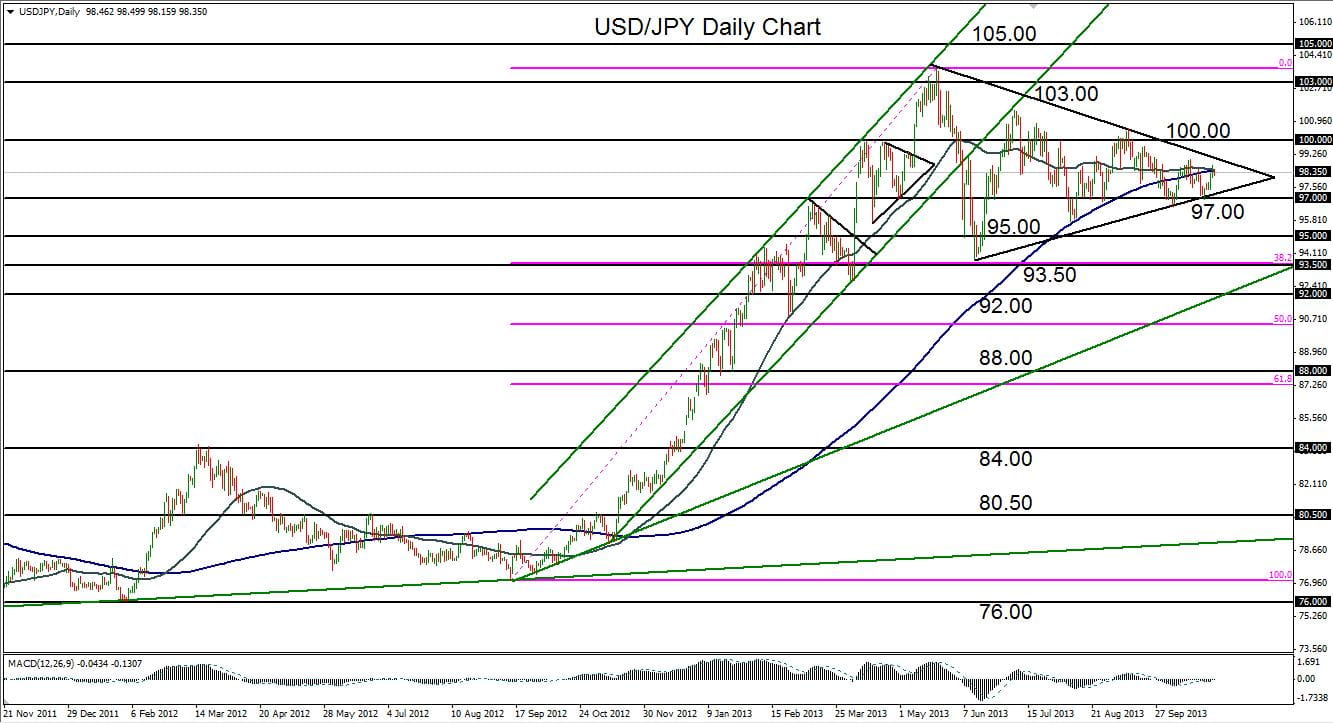
USD/JPY (daily chart) has further tightened the narrowing consolidation that has been in place for the past five months since the multi-year high of 103.72 was established in May. The 50-day moving average has just converged with the 200-day moving average, which reinforces the fact that the current trading range is at or close to the lower extremes of volatility. This progressive decrease in volatility over the past five months has formed a large and rough triangle pattern that frames the boundaries of the converging consolidation.
Most recently, the pair bounced off its key support level at 97.00 late last week, which was also the lower boundary of the triangle. The price is currently stalled at the noted convergence of the 50-day/200-day moving averages, which suggests that some type of equilibrium has been reached. From a technical perspective, the currency pair should soon be poised for a breakout of this consolidation. A breakout above the triangle should have a clear upside objective at the important 100.00 resistance level, followed by 103.00 further to the upside. A breakdown below the triangle and the 97.00 support level should find further downside support around the 95.00 and then 93.50 support levels.