USD JPY Solving the Fed puzzle and the possibility of 125 00
Howard Marks is the billionaire founder of the Oaktree Capital Management, and for my money, one of the best investment writers in the business. In […]
Howard Marks is the billionaire founder of the Oaktree Capital Management, and for my money, one of the best investment writers in the business. In […]
Howard Marks is the billionaire founder of the Oaktree Capital Management, and for my money, one of the best investment writers in the business. In his book, The Most Important Thing, he relays the importance of understanding market expectations and second level thinking as follows:
First level thinking says, “It’s a good company; let’s buy the stock.”
Second level thinking says, “It’s a good company, but everyone thinks it’s a great company, and it’s not. So the stock’s overrated and overpriced; let’s sell.”
As traders were planning ahead for yesterday’s FOMC meeting, everyone (literally including my retired-schoolteacher grandmother) “knew” that the Fed was going to raise interest rates. To adapt Marks’ example of second level thinking to the recent Fed decision and its impact on the dollar, the thought process would have been:
First level thinking says, “The Fed’s going to raise interest rates; let’s buy the dollar.”
Second level thinking says, “The Fed’s going to raise interest rates, but it’s going be a ‘dovish hike’ that will emphasize gradual hikes moving forward; let’s sell the dollar.”
As it turns out, traders who successfully solved yesterday’s Fed puzzle actually had to go even one level deeper, to “third level thinking”:
Third level thinking says, “The Fed’s going to raise interest and everyone expects a ‘dovish hike’, so if the central bank merely leaves its forecasts steady and Yellen follows her stereotypically noncommittal script, the dollar could rally; let’s buy the dollar.”
Of course, unless you have a rolodex of central bankers on speed dial, it’s difficult to know exactly what the Fed will do in advance, but knowing what the market is anticipating and how traders are positioned can still help you evaluate the probabilities and potential magnitude of the move around a given event.
Technical view: USD/JPY
This brings us to USD/JPY, which tends to have the cleanest and most logical reaction to major US economic developments. Not surprisingly, the buck is rallied against the yen yesterday, but we wanted to take a step back and look at a longer-term chart to get our bearings.
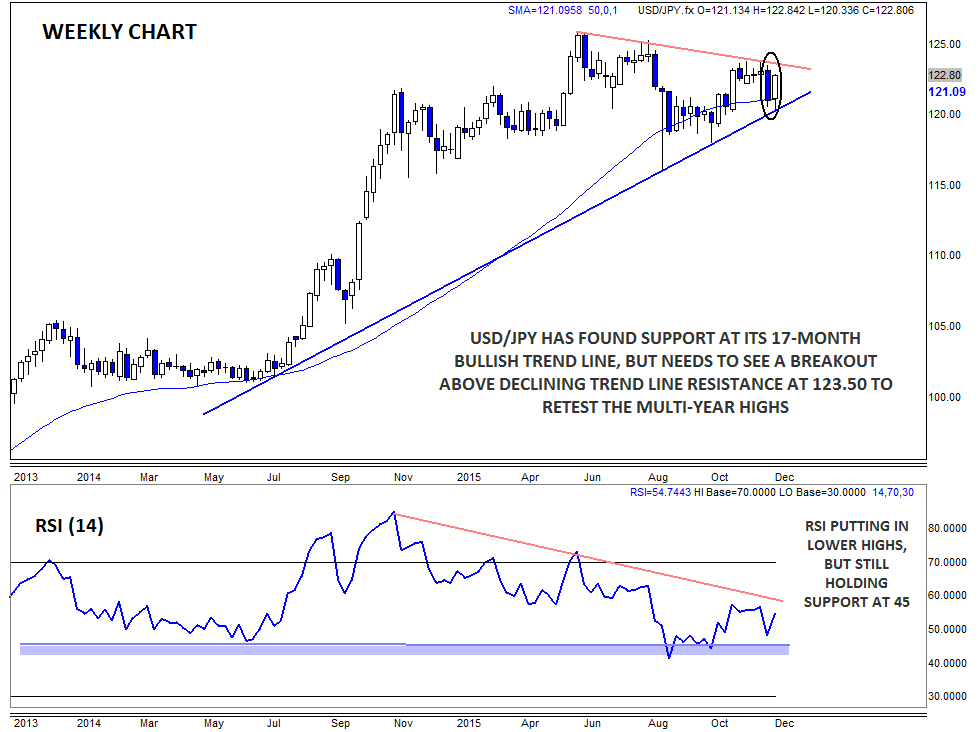
The weekly chart below shows that USD/JPY has been holding above a rising trend line for about 17 months now, though the pair has recently put in a few lower highs as well. Therefore, USD/JPY is forming a huge symmetrical triangle pattern. For readers who are unfamiliar, this pattern is analogous to a person compressing a coiled spring: as the range continues to contract, energy builds up within the spring. When one of the pressure points is eventually removed, the spring will explode in that direction.Not surprisingly, the pair’s RSI indicator is forming a compression pattern of its own, with the RSI putting on lower highs, but still finding support at the 45 level, signaling that the uptrend remains intact.
Flashing back to the exchange rate itself, this week’s Piercing candle* in development could foreshadow more buying pressure as we roll into next week. If seen, this could take us above the upper trend line near 123.50 and open the door for another run at the multi-year highs in the 125.00-126.00 zone. Of course, it’s also possible that we could see some end-of-year profit taking in the pair, but as long as bullish trend line support near 120.00 holds, the odds favor the bulls.