USD JPY rises to top of triangle consolidation
USD/JPY (daily chart shown below) has risen to approach the top of a large triangle consolidation pattern that has been in place since early December’s […]
USD/JPY (daily chart shown below) has risen to approach the top of a large triangle consolidation pattern that has been in place since early December’s […]
USD/JPY (daily chart shown below) has risen to approach the top of a large triangle consolidation pattern that has been in place since early December’s seven-year high just under 122.00 resistance.
This rise was prompted by Friday’s jump in the US dollar on a better-than-expected US employment report. Prior to this non-farm payrolls report, the currency pair had been languishing in a tight trading range below 118.00.
Friday’s move pushed USD/JPY up to hit the upper border of the large triangle pattern, slightly above the 50-day moving average and the 119.00 level, before retreating.
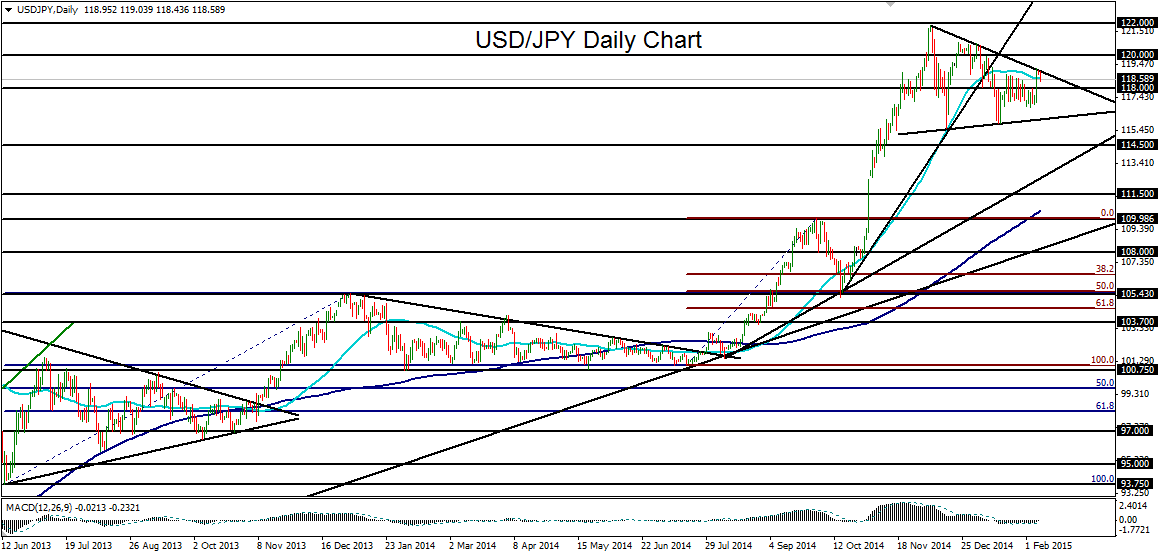
The currency pair currently trades within a relatively long-term bullish trend that extends back to late 2012 and which accelerated in the second half of last year.
The overall trend and technical indications for USD/JPY remain strong. With major support continuing to reside around mid-December’s 115.50-area low, any break above the triangle pattern should target the 122.00 resistance level once again, with a further upside target around 124.00 resistance.
