USD JPY rebounds after pullback
January 15, 2014 – USD/JPY (daily chart) has rebounded off its 50-day moving average after having pulled back in the past few trading days down […]
January 15, 2014 – USD/JPY (daily chart) has rebounded off its 50-day moving average after having pulled back in the past few trading days down […]
January 15, 2014 – USD/JPY (daily chart) has rebounded off its 50-day moving average after having pulled back in the past few trading days down to a low of 102.85.
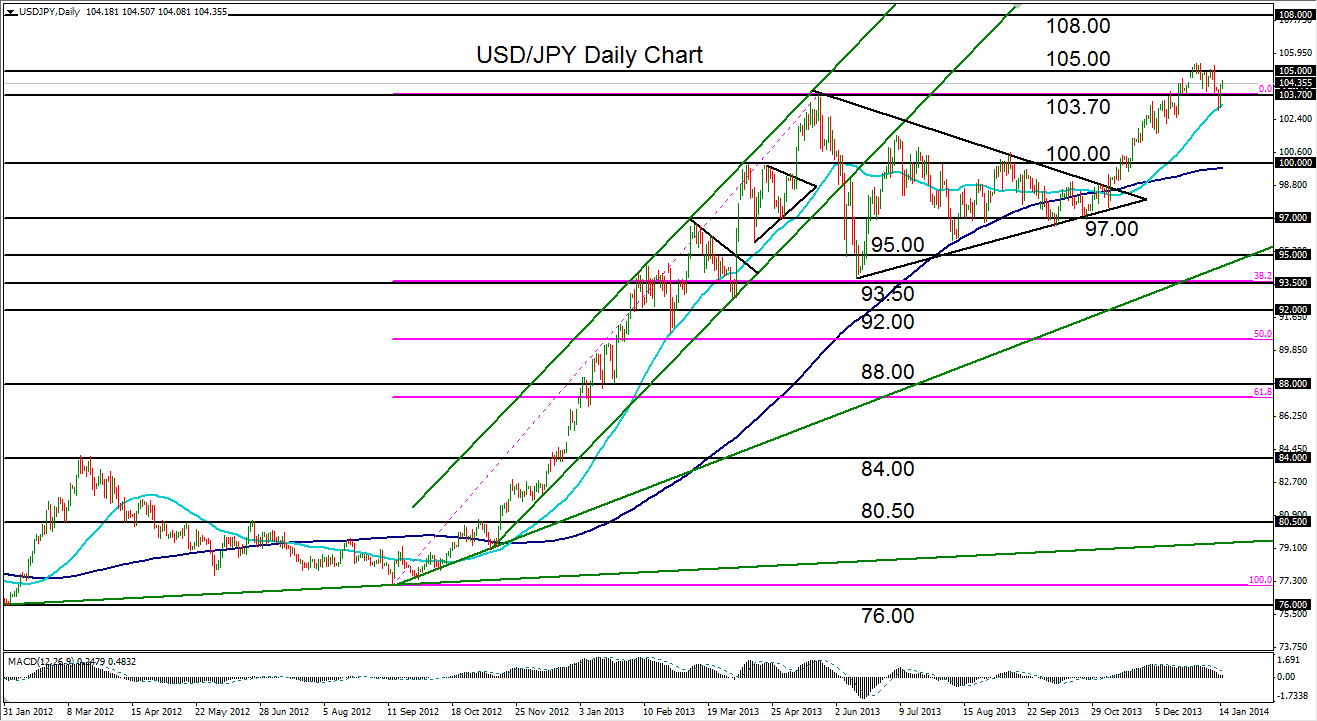
This pullback occurs within the context of a strong and steep bullish trend that has been in place for the past two months, and from a broader perspective, since September 2012.
The most recent bullish run began on a breakout above a large triangle pattern in early November, which advanced beyond the prior high of 103.72 (May 2013) to hit a five-year high of 105.43 at the very beginning of 2014.
Since that high was established, the pair has made the noted pullback – the most significant one since November.
Having just rebounded off its 50-day moving average, USD/JPY is still within an exceptionally strong bullish trend and continues to maintain a bullish outlook.
A major upside price target on a breakout above the noted 105.43 high resides around 108.00.
Downside support levels on any subsequent pullbacks reside around the 103.00 and then 101.50 price levels.
