USD JPY poised for breakout of consolidation
USD/JPY (daily chart) has been mired in a sideways consolidation for at least three months now, unable as of yet to extend the bullish trend […]
USD/JPY (daily chart) has been mired in a sideways consolidation for at least three months now, unable as of yet to extend the bullish trend […]
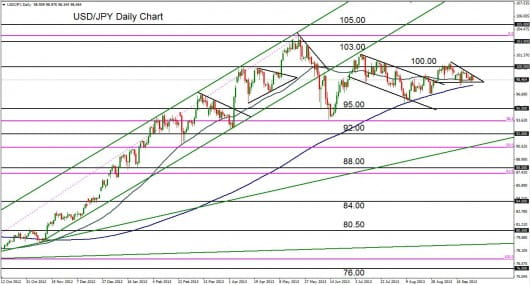
USD/JPY (daily chart) has been mired in a sideways consolidation for at least three months now, unable as of yet to extend the bullish trend that was previously in place from September 2012 to June of this year. Since the multi-year high of 103.72 was established in late May, the currency pair plummeted by almost 10% before recovering partially and embarking on a series of consolidation patterns.
From late June to late August a slightly downward-sloping parallel channel brought the pair down to its 200-day moving average, which was respected as support on at least two occasions. After the price broke the channel to the upside in the beginning of September, it made a failed attempt to rise above the key 100.00 level, only to fall into the current triangle pattern.
As this triangle has developed for the past several weeks, price volatility has progressively contracted and the pair should be poised for a potential impending breakout. On an upside breakout, the key level to watch continues to be 100.00, a breakout above which should target the 103.00 resistance level. A downside breakout should meet strong support around the noted 200-day average, followed by the 97.00 support region.