USD JPY Hits New 32 Month High at 93 50
USD/JPY (daily chart) as of February 5, 2013 has reached a new 32-month high at 93.50, which represents a full 21% increase in price from […]
USD/JPY (daily chart) as of February 5, 2013 has reached a new 32-month high at 93.50, which represents a full 21% increase in price from […]
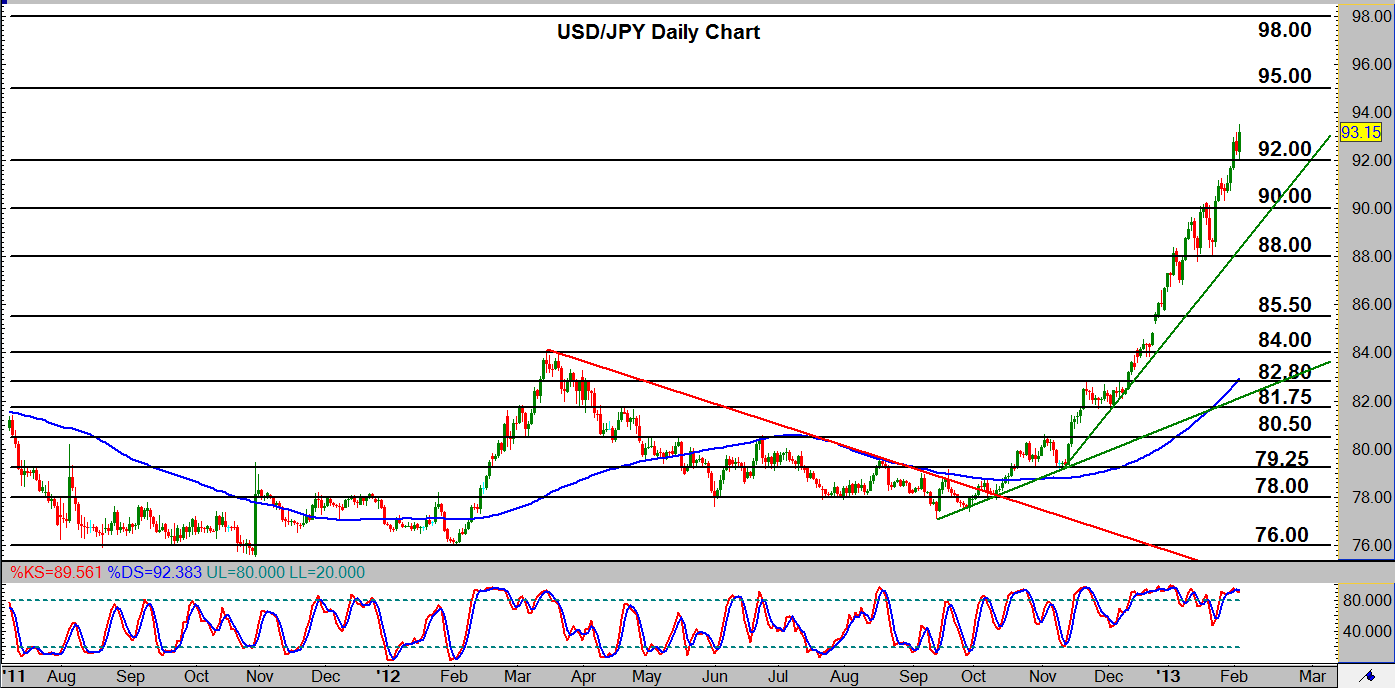
USD/JPY (daily chart) as of February 5, 2013 has reached a new 32-month high at 93.50, which represents a full 21% increase in price from its September 2012 low of 77.12 at the beginning of the current bullish trend. This steep and rapid ascent of the past five months has shown little indication of relenting, as bearish pullbacks and corrections have been very few and far between. The last significant correction occurred two weeks ago on a pullback from the 90.00 level to key 88.00 support, but even that posed only a small obstacle to the exceptionally strong bullish trend.
After having broken out above its previous 92.00 target late last week, price has a potential upside objective around the 95.00 resistance level, with further upside potential around 98.00. Before those levels may be reached, though, the rapid extension of the current uptrend could likely see another pullback. Nearby support on this potential pullback now resides around the 92.00 level, with further downside support on any deeper correction around the 90.00 level.