USD JPY hits five year high before pullback
USD/JPY (daily chart) hit a five-year high at 103.91 in early trading on Friday before pulling back down near the key 103.00 level. This new […]
USD/JPY (daily chart) hit a five-year high at 103.91 in early trading on Friday before pulling back down near the key 103.00 level. This new […]
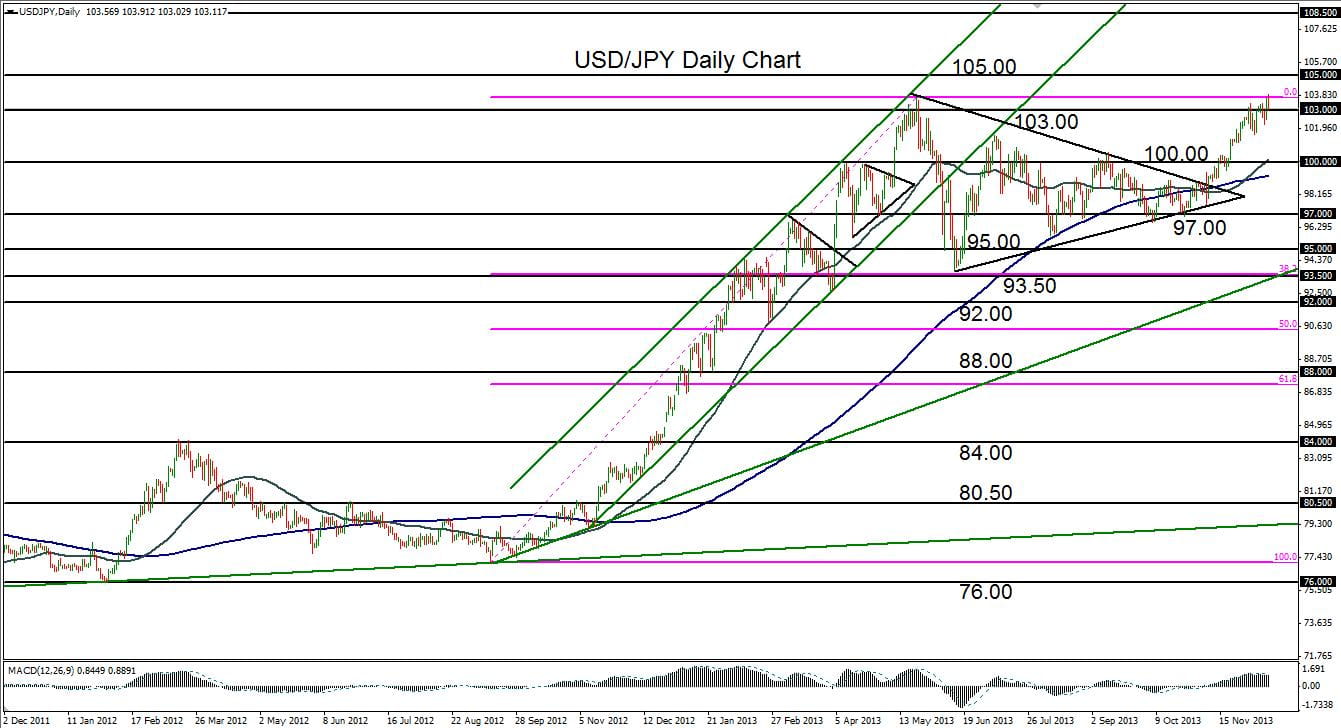
USD/JPY (daily chart) hit a five-year high at 103.91 in early trading on Friday before pulling back down near the key 103.00 level. This new high slightly surpasses the 103.72 high that was established in May – a price level not previously seen since October 2008.
Having reached this new height, if only briefly, the pair has tentatively confirmed a continuation of the strong bullish trend that has been in place since the September 2012 low near 77.00. This strong uptrend was interrupted by a plunging correction after the noted May 103.72 high, and spent the next five months consolidating within a large triangle pattern formation that was finally broken to the upside in early November. That breakout resulted in a sharp climb that quickly reached and surpassed the key 100.00 psychological level and then went on to reach its 103.00 target in early December.
Having just established a new long-term high, the pair continues to exhibit a general bullish bias into the end of the year. If the price is able to maintain above 103.00, the next major resistance objectives to the upside reside around 105.00 and then 108.50. If instead the current highs are respected as a strong double-top resistance level, key downside support on a potential trend failure continues to reside around the major 100.00 level.