USD JPY falters on Fed equities plunge
Wednesday’s rather dovish FOMC minutes from the Fed’s meeting last month raised some doubts about the prospects of a September rate hike, and prompted a […]
Wednesday’s rather dovish FOMC minutes from the Fed’s meeting last month raised some doubts about the prospects of a September rate hike, and prompted a […]
Wednesday’s rather dovish FOMC minutes from the Fed’s meeting last month raised some doubts about the prospects of a September rate hike, and prompted a broad sell-off in the US dollar.
At the same time, renewed volatility in global equity markets, most notably in China, the US, and Europe, helped foster a risk averse market sentiment that served to boost traditional “safe haven” assets like gold and the Japanese yen.
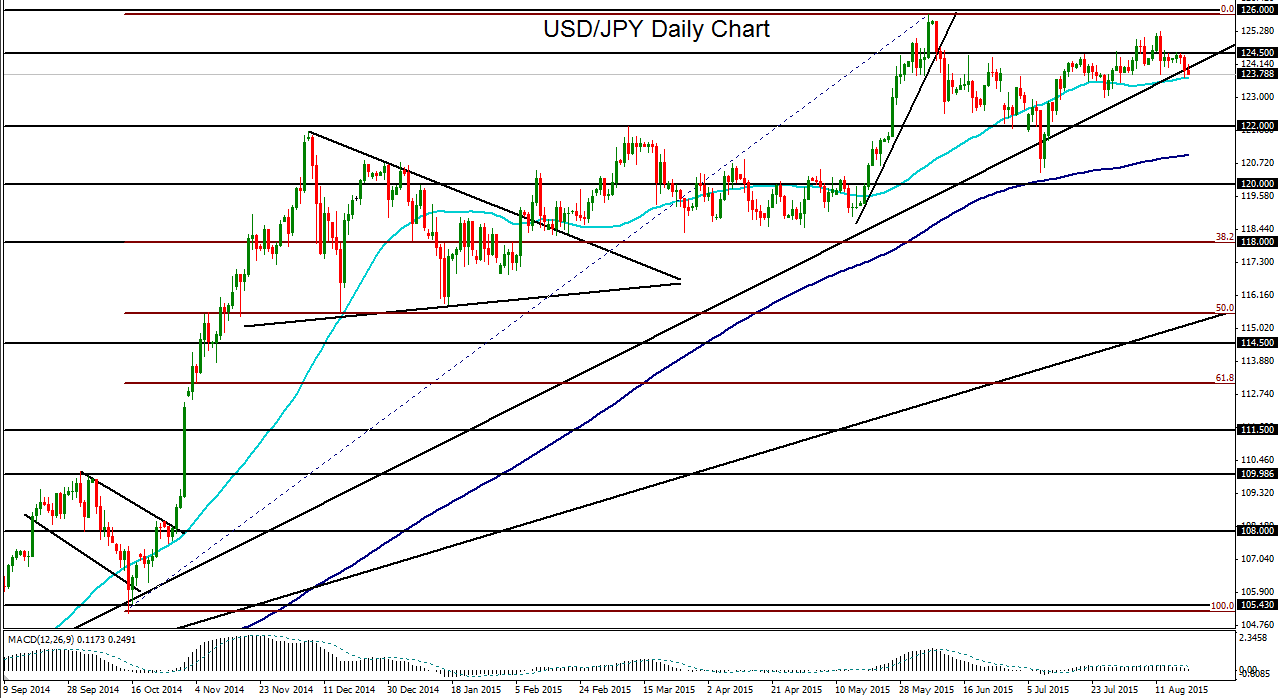
These events together triggered a significant drop for USD/JPY on Wednesday and early Thursday that pressured the currency pair down to its 50-day moving average and slightly below a key uptrend support line extending back a year to August of last year.
If circumstances warrant delays in an initial Fed rate hike and/or further turmoil continues to affect global equities markets, especially China’s, USD/JPY could likely find itself declining in an extensive pullback or correction.
We saw a similar scenario begin to play out in early July when USD/JPY dropped below key support around the 122.00 level as well as a further break below the noted uptrend support line that has defined the accelerated uptrend for the past year. Primarily due to the safe haven phenomenon strengthening the Japanese yen in response to China’s troubled equity markets, the USD/JPY made a rapid decline before recovering and resuming the entrenched uptrend.
In the event of another such breakdown on a dollar correction and stronger yen, USD/JPY could once again drop towards the noted 122.00 support level and possibly begin to re-target the next major downside support objective around the 120.00 level, below the 200-day moving average. On any potential break below 120.00, the next key downside target is at the 118.00 support level, which is also the 38.2% Fibonacci retracement of the bullish run from the 105.00-area low in October of last year to the 13-year high near 126.00 in June. To the upside, this key 126.00 level continues to be the major resistance area to watch for USD/JPY.
