USD JPY drifting lower towards major support
USD/JPY (daily chart shown below) has continued to trade in a progressively tightening range with relatively low volatility, extending the prolonged consolidation that has been […]
USD/JPY (daily chart shown below) has continued to trade in a progressively tightening range with relatively low volatility, extending the prolonged consolidation that has been […]
USD/JPY (daily chart shown below) has continued to trade in a progressively tightening range with relatively low volatility, extending the prolonged consolidation that has been in place since the five-year high of 105.43 was reached in early January.
During the course of this half-year trading range, the currency pair has consistently drifted lower towards major support around the 100.75 level, which was established as a key support level in early February.
Since February, price action has fluctuated well above this level – at one point hitting an intermediate high of 104.11 in April – but has consistently been drawn back down towards the noted 100.75 support.
Thursday’s price action saw USD/JPY once again approaching this support by hitting a low around 101.00 before bouncing on Friday.
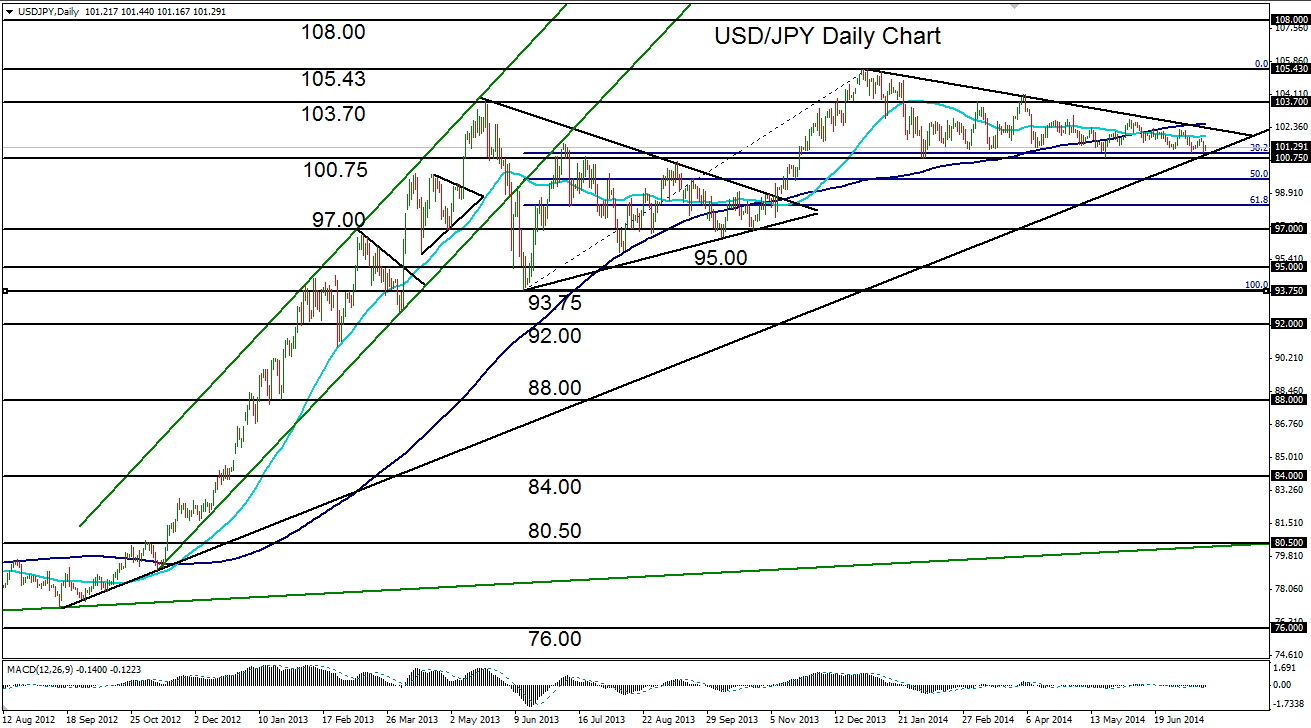
In dropping to this level, the pair also hit both a long-term uptrend line extending back to late 2012 as well the 38% Fibonacci retracement level of the rise from 93.75 in mid-2013 up to the noted five-year high of 105.43.
Contributing to an overall bearish bias is the fact that the 50-day moving average made a rare cross below the 200-day moving average just last month.
Any breakdown below the major support at 100.75 could be a catalyst for further declines targeting the key 97.00 support level to the downside.
Current upside resistance within the continued trading range resides around the 102.75 level, last reached in early June.
