USD JPY bounces from short term pullback
January 28, 2014 – USD/JPY (daily chart) has tentatively rebounded from the recent pullback – that prompted a decline from its five-year high of 105.43 […]
January 28, 2014 – USD/JPY (daily chart) has tentatively rebounded from the recent pullback – that prompted a decline from its five-year high of 105.43 […]
January 28, 2014 – USD/JPY (daily chart) has tentatively rebounded from the recent pullback – that prompted a decline from its five-year high of 105.43 at the very beginning of 2014 – down to the 7-week low of 101.75 that was hit in the beginning of this week.
This pullback, which notably broke down and closed below the key 50-day moving average for the first time since November, represented a relatively modest 3.5% drop from its recent multi-year high.
While this decline is significant, it doesn’t yet pose any substantial obstacle to the strong bullish trend that began in late 2012 and resumed around three months ago.
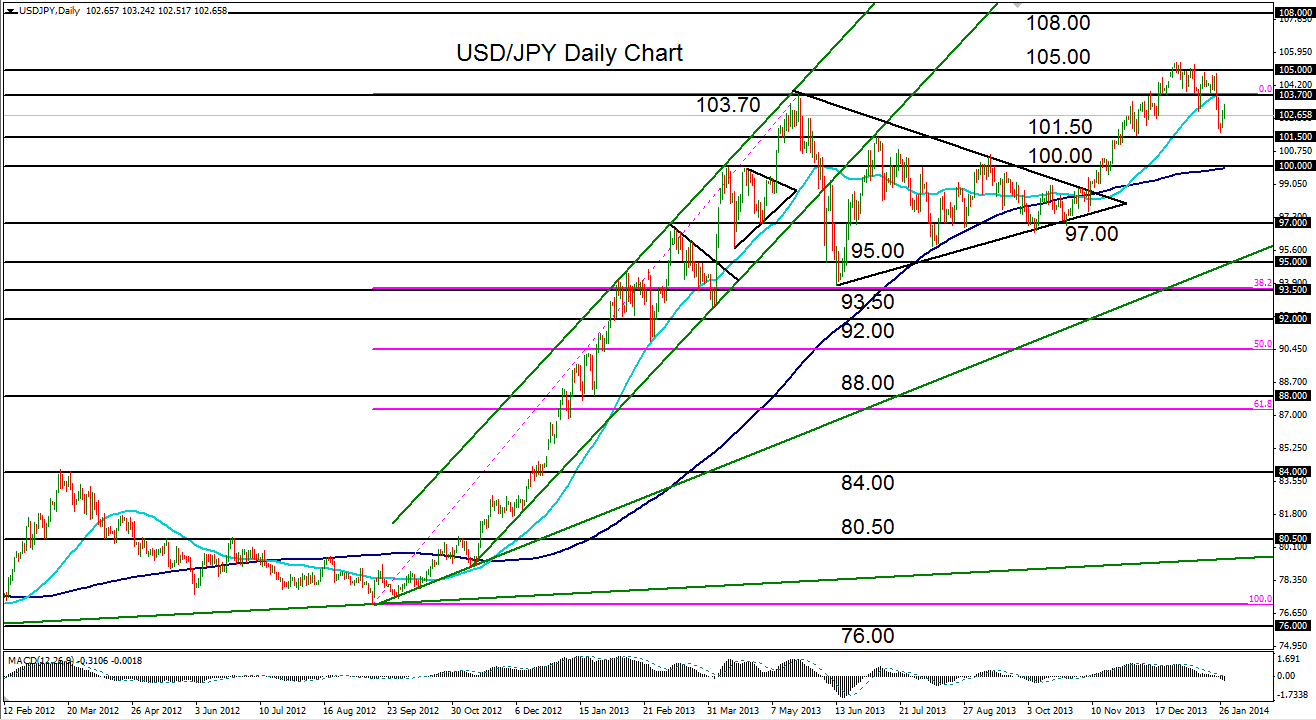
As mentioned, the pair bounced from a low of 101.75 early in the trading week, which was just slightly above key support around the 101.50 price region.
USD/JPY is still within an exceptionally strong bullish trend and continues to maintain a bullish outlook. Despite the pullback, the pair is showing signs of recovering and is still situated well above its 200-day moving average.
The major upside price target once again resides around 105.00, with any breakout above the noted 105.43 high, potentially targeting further resistance around 108.00.
Downside support currently continues to reside around 101.50, followed further to the downside by the 100.00 psychological support level.
