USD JPY attempts advance from lows
USD/JPY (daily chart shown below) has attempted to advance off its early February 100.75-area support lows, which established more than a two-month low for the […]
USD/JPY (daily chart shown below) has attempted to advance off its early February 100.75-area support lows, which established more than a two-month low for the […]
USD/JPY (daily chart shown below) has attempted to advance off its early February 100.75-area support lows, which established more than a two-month low for the currency pair.
Those lows also coincided approximately with the 38% Fibonacci retracement level of the generally bullish move from the June 93.77 low up to the 105.43 high at the very beginning of the year.
The recent decline from that 105.43 five-year high down to the noted 100.75 low represents a 4.4% pullback within the long-term bullish trend that extends back to the September 2012 lows near 77.00.
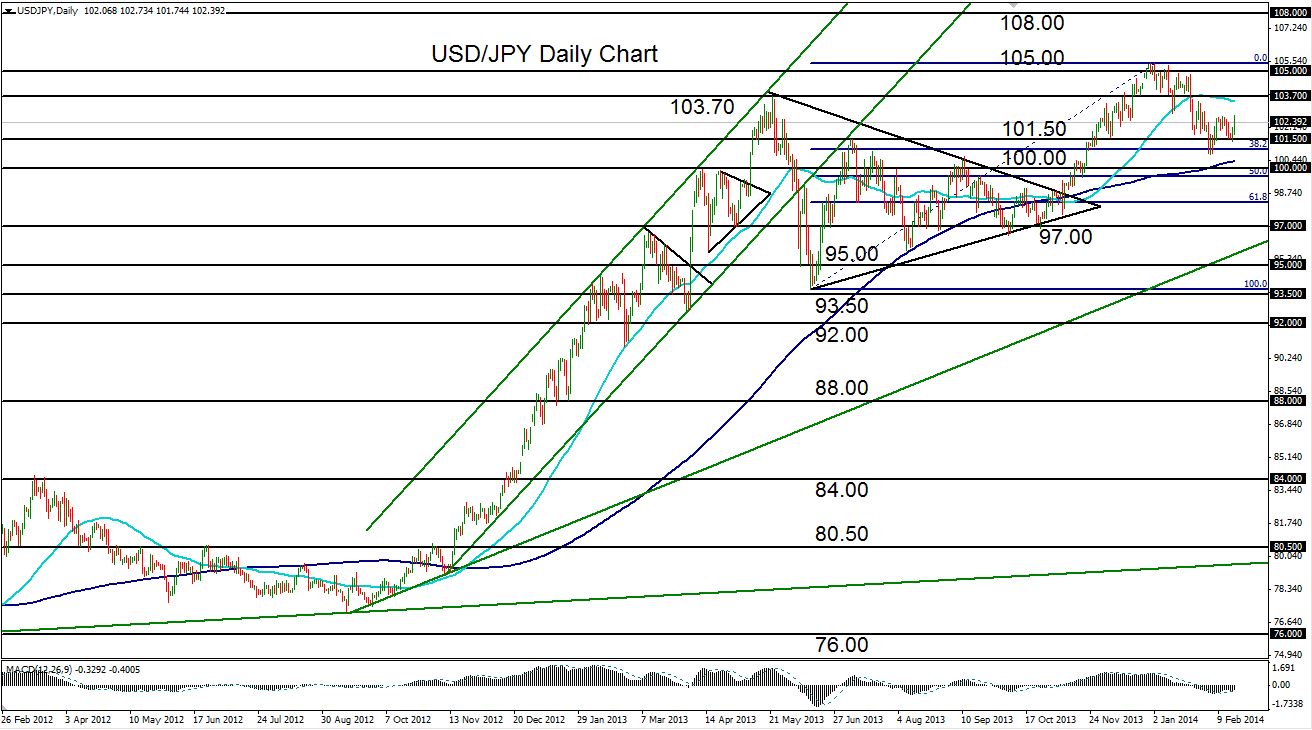
The fact that USD/JPY has begun a tentative rebound from this pullback lends some strength to a potential resumption of the longstanding uptrend.
With the pair still moving comfortably above its 200-day moving average, USD/JPY currently continues to display a bullish technical bias.
With immediate downside support continuing to reside around the 100.75 pullback lows, upside resistance targets on a potential recovery and resumption of the underlying trend reside once again around 103.70 and then the noted 105.43 long-term high.
