USD JPY advances sharply after US GDP data
USD/JPY (daily chart shown below) has advanced sharply within its prolonged trading range to reach and tentatively breach its 200-day moving average after the release […]
USD/JPY (daily chart shown below) has advanced sharply within its prolonged trading range to reach and tentatively breach its 200-day moving average after the release […]
USD/JPY (daily chart shown below) has advanced sharply within its prolonged trading range to reach and tentatively breach its 200-day moving average after the release of better-than-expected US GDP data on Wednesday. This rise extends a steady advance for the past two weeks from a low just above 101.00 in mid-July.
Since the beginning of the year, when the currency pair hit a five-year high of 105.43, USD/JPY has gradually drifted lower in an extended trading range with progressively diminishing volatility.
During the course of the past seven months, this trading range has established the 100.75 level as the key support level to the downside, and has also formed a descending trend line to the upside that extends back to the noted 105.43 high.
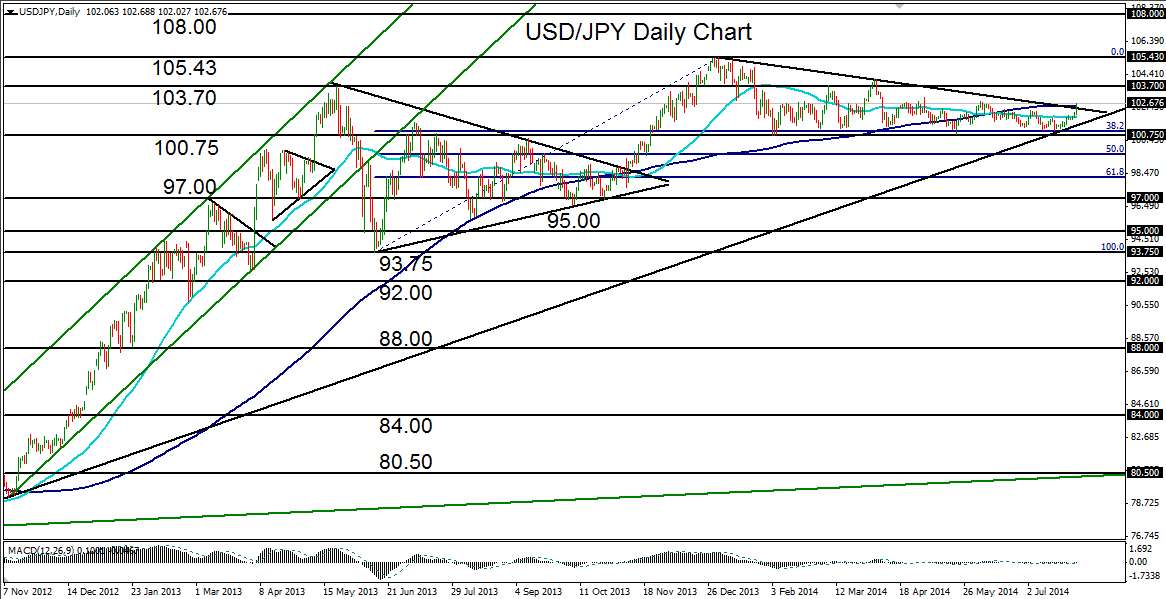
While the 100.75 support level was respected with a rebound two weeks ago, both the descending trend line and the 200-day moving average have tentatively been broken to the upside as of Wednesday morning as a result of the dollar’s rise on GDP data.
If the currency pair can sustain this spike, the next major upside resistance objective resides around the 103.70 level.
Any breakout above that level should target a re-test of the long-term high at 105.43.
To the downside, major support on any pullback continues to reside around 101.00.
