USD CAD testing key support ahead of FOMC
The two-day FOMC meeting will conclude on Wednesday at 19:00 GMT and Janet Yellen’s press conference will begin shortly afterwards at 19:30. It could be […]
The two-day FOMC meeting will conclude on Wednesday at 19:00 GMT and Janet Yellen’s press conference will begin shortly afterwards at 19:30. It could be […]
The two-day FOMC meeting will conclude on Wednesday at 19:00 GMT and Janet Yellen’s press conference will begin shortly afterwards at 19:30. It could be a long wait until then. Expect to see more chop in the FX markets than a Jackie Chan movie. The Fed will most likely hike rates by 25 basis points. Almost everyone expects that. Thus, for the dollar to strengthen further, the Fed will need to communicate to the markets that it will hike rates more aggressively than expected in 2017. But if the Fed delivers a dovish statement or forward guidance then the dollar could drop sharply in reaction.
Now the dollar has been rising against most major currencies in recent days, but it has really struggled against its northern neighbour. The Canadian dollar has been on a good run thanks mainly to the rising prices of oil. For the USD/CAD in particular, Wednesday will likely be a very volatile day. The oil-linked CAD is likely to move along with crude prices in reaction to the weekly US crude stockpiles report due for release at 15:30 GMT. Prior to this, there will be plenty of second-tier economic data from the US to provide some short-term volatility for the USD. Among other things, we will have retail sales, PPI and industrial production. But the elephant in the room will be the Fed.
The USD/CAD bulls will be desperate to see a more hawkish-than-expected Federal Reserve. The Loonie has been falling sharply ever since that OPEC agreement to cut its supplies in an effort to shore up prices. With oil getting stronger by the day, the USD/CAD could absolutely collapse, especially if the Fed turns out to be less hawkish than expected tomorrow.
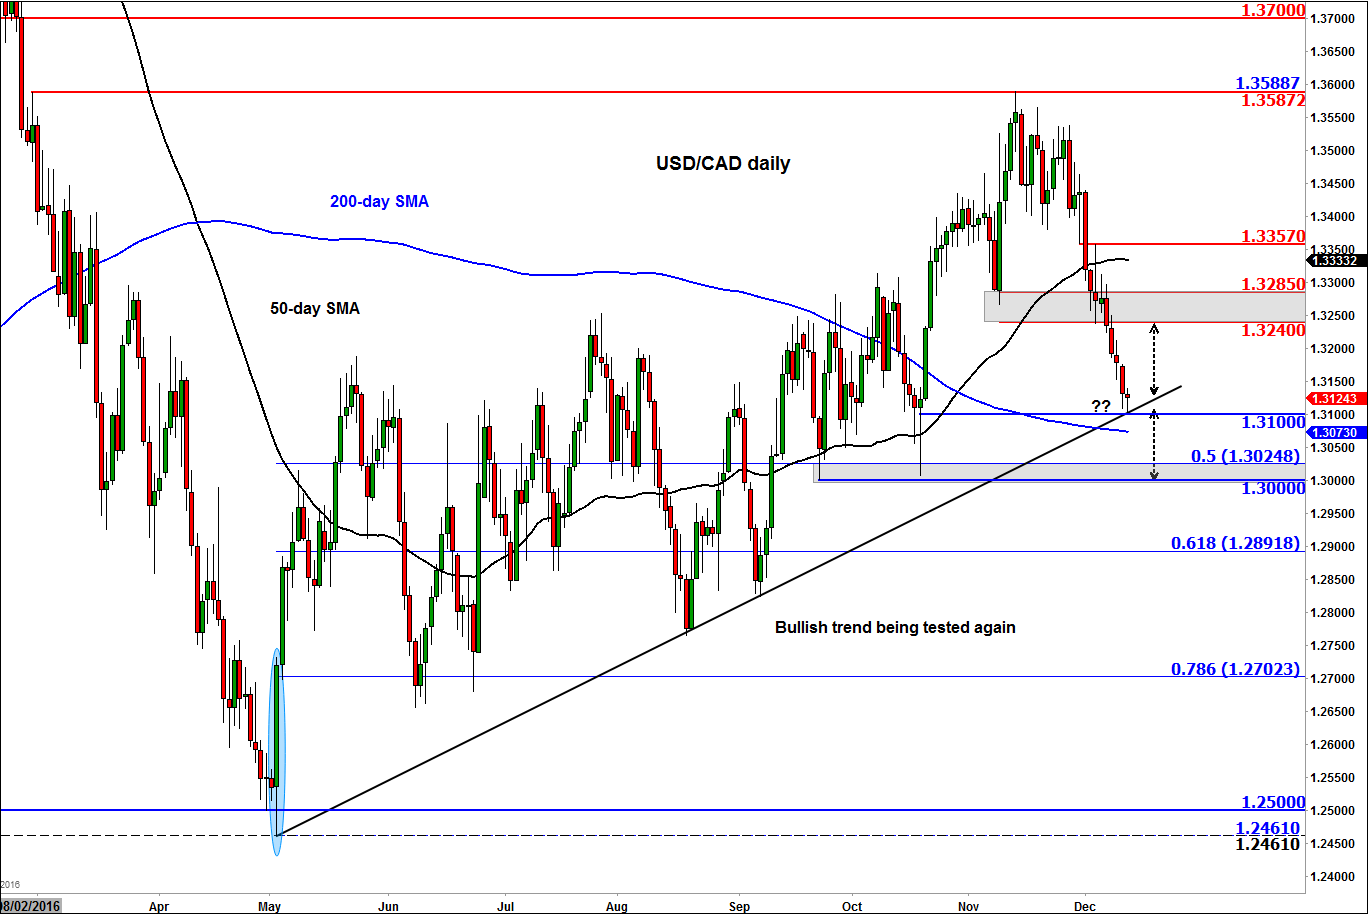
But from a technical perspective, the USD/CAD is currently testing another “key” support after breaking several of these levels recently. This one is at 1.31 which is where a rising trend line comes into play. If this potential support also gives way then we may see a much larger correction going forward, though the 200-day average at 1.30705 area may prevent that from happening. Below the moving average is the psychologically-important 1.30 handle where price had bounce from in the past. As this area was also the last swing low, lots of stops are likely to be below here which means there is the possibility for a run on those orders, which, if triggered, could accelerate the downward move towards the 61.8% Fibonacci level at 1.2890, or even lower.
If on the other hand the Loonie turns around here then there is really not much prior reference points to watch until the 1.3240-85 area which was previously support and resistance. This area could then turn into resistance upon a potential re-test.