USD CAD stalls below new six year high
After hitting a new six-year high just above 1.3000 resistance late last week, USD/CAD (daily chart shown below) opened the new trading week by reaching […]
After hitting a new six-year high just above 1.3000 resistance late last week, USD/CAD (daily chart shown below) opened the new trading week by reaching […]
After hitting a new six-year high just above 1.3000 resistance late last week, USD/CAD (daily chart shown below) opened the new trading week by reaching a higher high of 1.3023 before stalling and retreating slightly on Monday.
The currency pair has reached its previously projected 1.3000 target after a steep, month-long ascent that saw several combined factors contributing to continued US dollar strengthening and progressive Canadian dollar weakening.
Chief among these factors have been rising expectations of an impending Fed rate hike, last week’s Bank of Canada interest rate cut, and plunging crude oil prices.
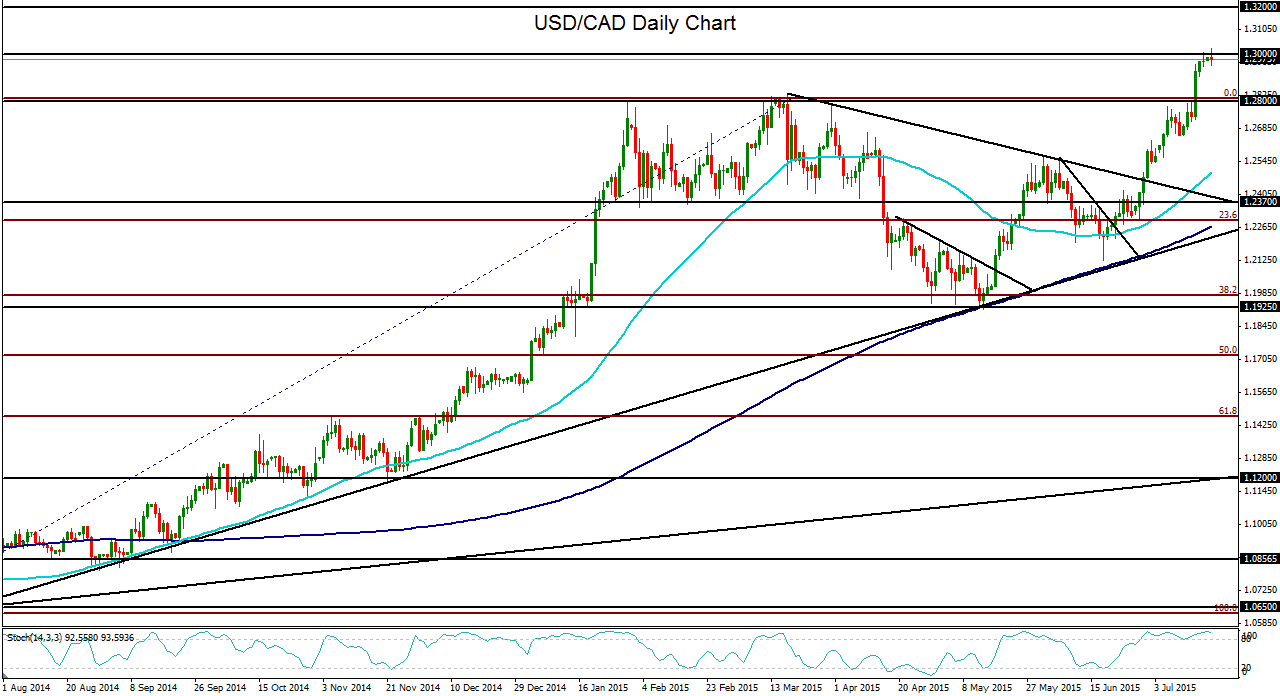
This latest USD/CAD run began after a downswing in mid-June that turned back to the upside just above both the 200-day moving average and a key uptrend line that has been in place for the past year. That turn was accentuated by a clear bullish hammer candle. Since then, the currency pair has climbed virtually unremittingly.
With the US dollar continuing to dominate against other major currencies and the Canadian dollar weakened considerably from the BOC rate cut and low oil prices, the outlook for USD/CAD remains bullish.
In the event of a sustained breakout above the noted 1.3000 resistance level, the next major upside target is 1.3200, last reached in 2004. To the downside, any pullback from the current highs should meet strong support around the 1.2800 level, a key prior resistance level.
