USD CAD slumps ahead of Bank of Canada rate statement
As crude oil rallied by more than 4% on Tuesday, the oil-linked Canadian dollar surged against a weaker US dollar, pressuring USD/CAD to dip back […]
As crude oil rallied by more than 4% on Tuesday, the oil-linked Canadian dollar surged against a weaker US dollar, pressuring USD/CAD to dip back […]
As crude oil rallied by more than 4% on Tuesday, the oil-linked Canadian dollar surged against a weaker US dollar, pressuring USD/CAD to dip back down below the key 1.3000 psychological level.
Looking ahead, the currency pair could see some heightened volatility on Wednesday morning due to the Bank of Canada’s release of its rate statement and monetary policy report. The central bank is expected to keep rates steady at 0.50%, as has been the case since rates were unexpectedly cut from 0.75% almost exactly a year ago.
Aside from the Bank of Canada report, Wednesday also brings the weekly US crude oil inventory numbers from the Energy Information Administration (EIA). This weekly report routinely induces volatility in both the crude oil markets and the Canadian dollar, and this time may be no exception. The past several weeks have seen steady declines in US crude oil stocks, providing some support for oil prices. Wednesday’s report is expected to show yet another draw, this time for a decline of 3.25 million barrels after the prior week’s 2.2-million-barrel draw. The American Petroleum Institute will be releasing its own data on crude oil inventories on Tuesday – this data is often used to further set expectations for Wednesday’s EIA report.
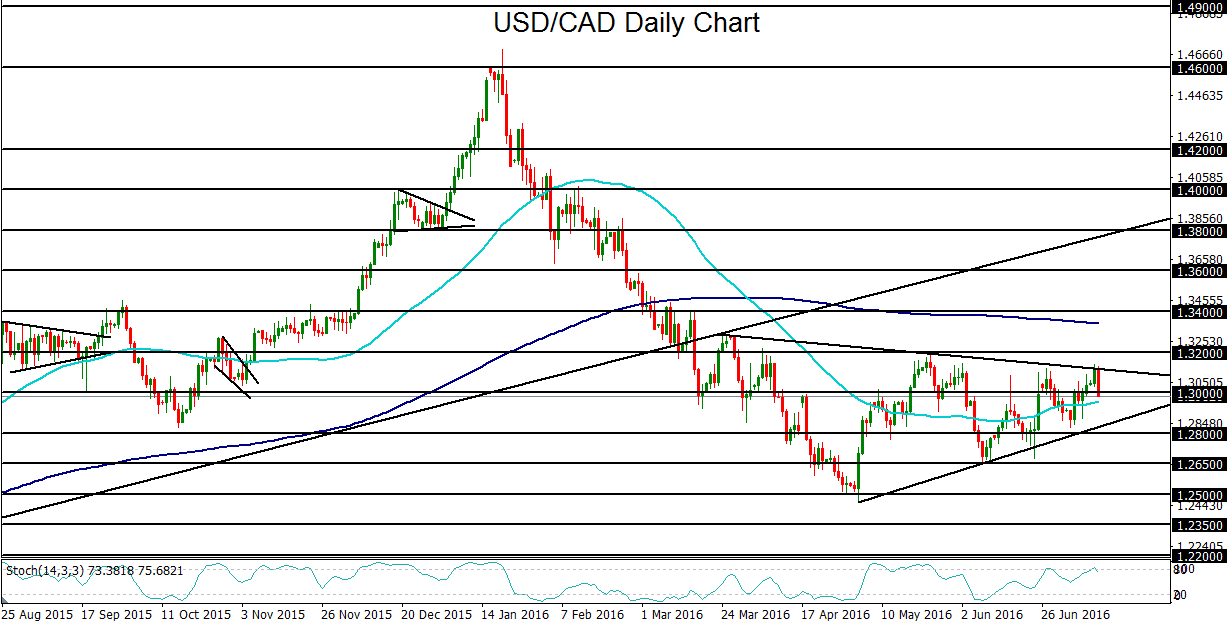
From a technical perspective, USD/CAD has been trading in a large triangle consolidation pattern since its freefall from the beginning of the year abruptly halted in early May. Since May, the currency pair has been stuck in a trading range roughly between 1.2500 to the downside and 1.3200 to the upside. The 50-day moving average has been running consistently through the middle of this trading range, highlighting USD/CAD’s lack of direction in the past few months.
If USD/CAD reverts and sustains below the 1.3000 level this week, a key bearish indication would be a break down below the noted triangle pattern, in which case, the next major downside target would be around the 1.2650 support level. In contrast, if price bounces from the 1.3000 level, a bullish break above the triangle could begin to target the 1.3400 resistance level.