USD CAD rebound could be short lived
The USD/CAD has collapsed after its parabolic rise ended in mid-January, when oil prices first showed signs of stabilisation. Since peaking at just shy of […]
The USD/CAD has collapsed after its parabolic rise ended in mid-January, when oil prices first showed signs of stabilisation. Since peaking at just shy of […]
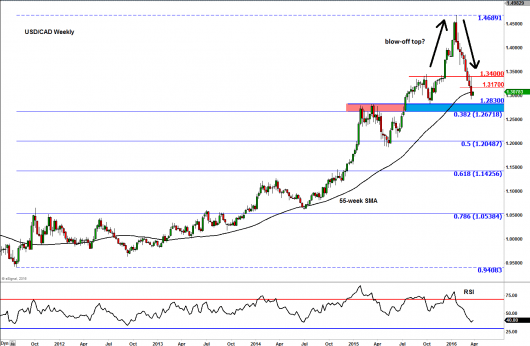
The USD/CAD has collapsed after its parabolic rise ended in mid-January, when oil prices first showed signs of stabilisation. Since peaking at just shy of 1.4700, the Loonie has tumbled to below 1.30, hitting a low of 1.2925 last week. It has shed in the process some 1765 pips from the high to the low, or almost 23 per cent in the space of only nine weeks. At the start of this week, the USD/CAD has bounced back somewhat. It is interesting to note that the CAD has weakened here despite the strong Canadian retail sales data that we saw at the end of last week. With oil prices also looking constructive, the rebound in this currency pair looks to be driven by the US dollar rather the Canadian dollar. As such, it is unlikely to last.
Indeed, from a technical point of view, the longer term outlook on the USD/CAD continues to look bleak. As the weekly chart shows, below, the Loonie is currently beneath a pivotal support and resistance area around 1.3400, and below a short-term resistance level at 1.3170. The RSI has not reached the “oversold” threshold of 30 yet, so there is plenty of room for further losses. In fact, the selling pressure could accelerate if the next support zone in the 1.2670-2830 zone fails to hold. This area is where previous resistance meets with the 38.2% Fibonacci retracement of the long-term upward swing.
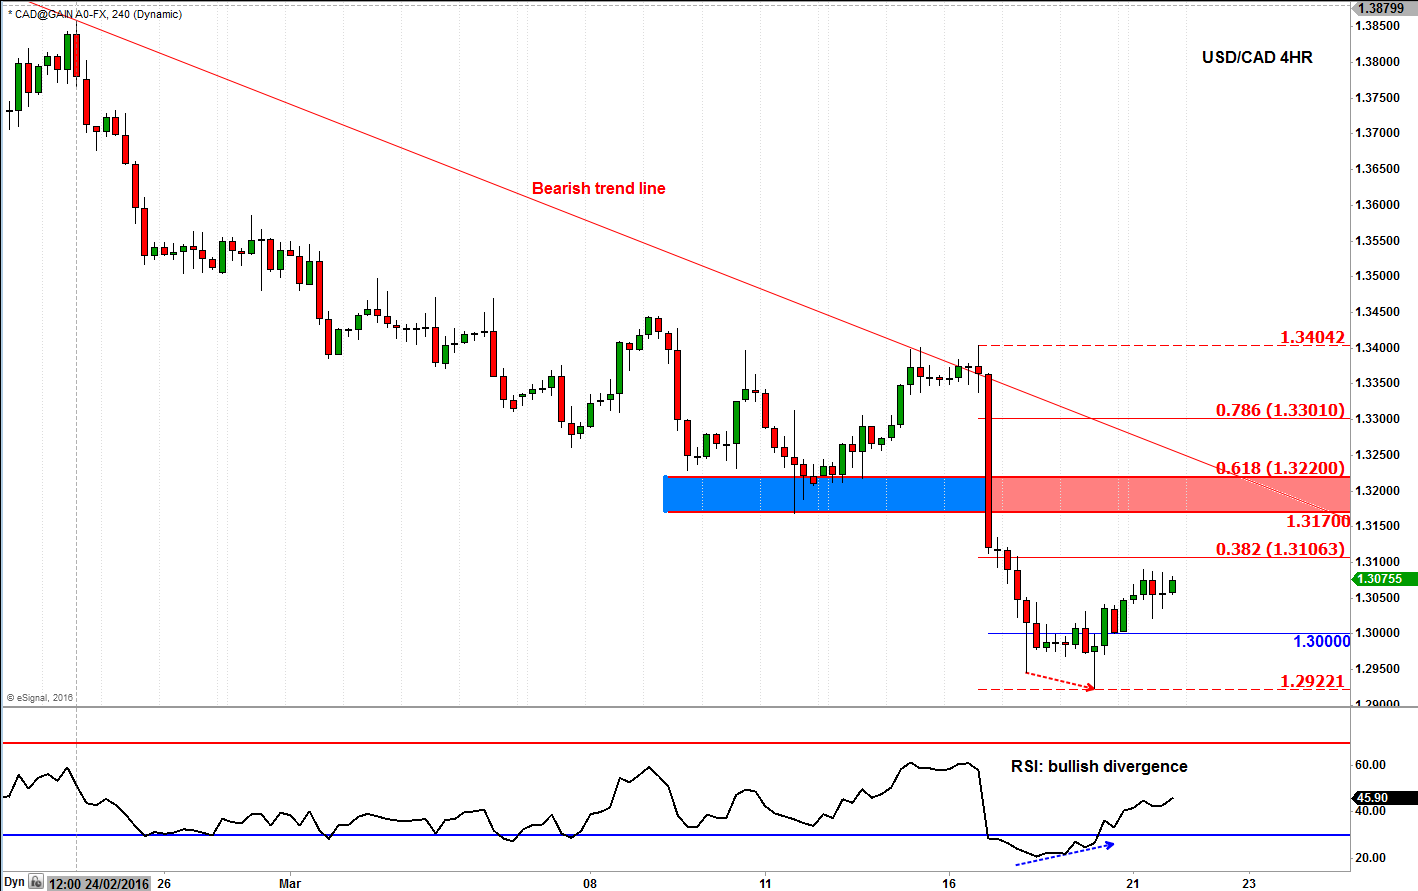
Zooming in to the slightly lower 4-hour time frame, in figure 2, and we can see why the USD/CAD has rebounded: the RSI was at the severally “oversold” territory below 30 and there was a short-term failure to hold below the prior low at the end of last week. Ahead of the weekend, the sellers probably took profit on their shorts around the psychologically-important 1.30 handle, leading to a modest bounce which has continued in this data-void session. But key resistance is looming around 1.3170, a level which was previously support. In fact it is a resistance zone that needs to be watched rather than just a level. The 1.3170 level is the lower end of this resistance range, while the upper end is where the bearish trend line meets with the 61.8% Fibonacci retracement level, around 1.3220.
So, should the Loonie get to this 1.3170/1.3220 area, I would expect to see a sell-off of some sort. Alternatively, a break below last week’s low at the 1.2920/5 area should open the way for a potential drop towards the area highlighted shown on the weekly chart. However, a break above the noted trend line around 1.3170/1.3220 area would be deemed a bullish outcome. In this potential scenario, a rally towards, and possibly beyond, the key resistance level at 1.3400 would become likely. For this to happen, we will either need the US dollar to rebound significantly or oil prices to collapse.