USD CAD Maintains Strong Bullish Trend
June 24, 2015 – USD/CAD (daily chart shown below) has continued to maintain the bullish trend that has been in place since late 2012, which […]
June 24, 2015 – USD/CAD (daily chart shown below) has continued to maintain the bullish trend that has been in place since late 2012, which […]
June 24, 2015 – USD/CAD (daily chart shown below) has continued to maintain the bullish trend that has been in place since late 2012, which began to accelerate its climb around one year ago.
This strong bullish trend is clearly defined by an uptrend support line extending back to the intermediate lows of July 2014. Currently running in very close proximity to this trend line is the key 200-day moving average, providing additional support to the trend.
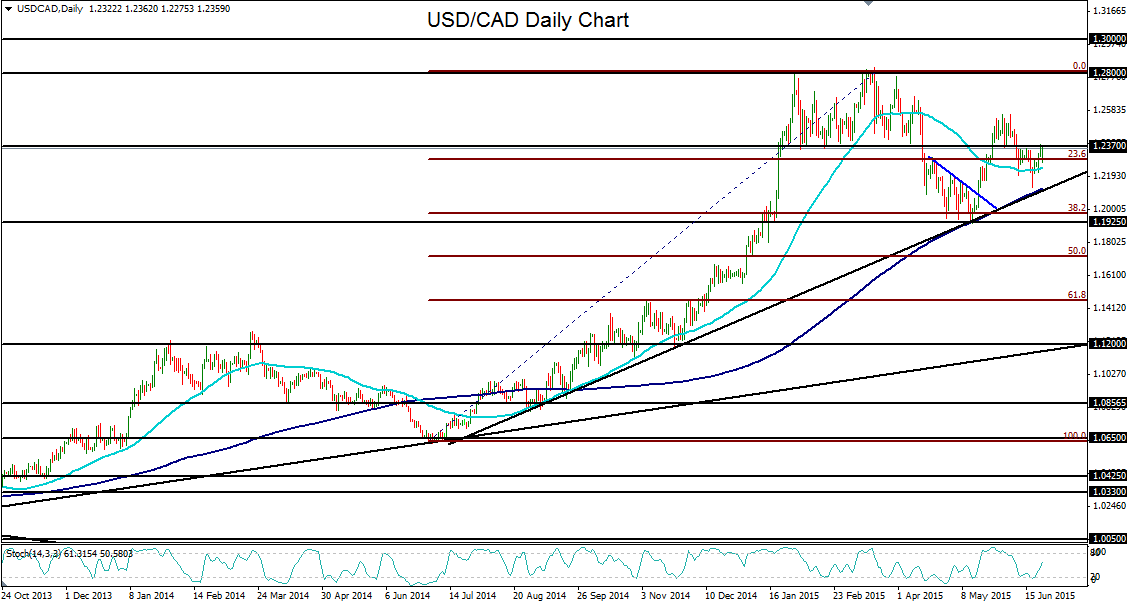
The uptrend line has been tested and respected on multiple occasions, with the most recent test occurring just last week when the currency pair dipped close to the trend line. On this dip, price action formed a clear hammer reversal candle on the daily chart and then rebounded for the past week on general US dollar strengthening.
Currently, USD/CAD has risen to re-approach and tentatively breach key resistance around 1.2370, a price level that has repeatedly served as both support and resistance in the recent past, most notably during the first quarter of this year.
Any sustained break above this key level could once again place the currency pair in position to target a re-test of June’s resistance highs around 1.2560. Further to the upside, on any continuation of bullish momentum, lies the major 1.2800 resistance objective. This is the area of the six-year highs that were reached in March.
Downside support continues to reside around the noted uptrend line and the 200-day moving average that currently shadows the trend line.
