USD CAD in focus ahead of data holding above key support
Yesterday saw the USD/CAD arrive at and then bounce from a major technical support level of 1.2835 after its recent retreat from a major Fibonacci […]
Yesterday saw the USD/CAD arrive at and then bounce from a major technical support level of 1.2835 after its recent retreat from a major Fibonacci […]
Yesterday saw the USD/CAD arrive at and then bounce from a major technical support level of 1.2835 after its recent retreat from a major Fibonacci exhaustion area. What it does next could determine the direction for the next several days at the very least, though we may have potentially already seen the top for the Loonie.
In truth, a lot will depend on the direction of oil prices, with crude being Canada’s number one commodity export. Oil actually managed to bounce back strongly late Thursday as traders shrugged off news of a sharp 7.6 million-barrel-increase in US oil stocks, blaming seasonal factors behind the build. The devil was in the detail of the report, which among other things revealed some bullish factors: a decrease in oil products – gasoline and distillates – and a small fall in production. Oil also got a lift from speculation that Russia is ready to talk with the OPEC about a possible production cut. Though crude may be slightly lower today and has given up most of its sharp gains from the previous week, there is still the possibility that a bottom was hit in August. If this is correct, there is a good chance the USD/CAD currency pair may have peaked at 1.3455 at the end of September.
In addition to oil prices, traders will need to watch the incoming macroeconomic data from North America. US numbers have recently hit a soft patch, causing investors to push back their Federal Reserve rate hike expectations. Further deterioration in US data in particular will be bad news for the USD/CAD. Today’s numbers include Industrial Production, Capacity Utilization, UoM Consumer Sentiment, JOLTS Job Openings and TIC Long-Term Purchases. Ahead of these numbers, we will have a couple of Canadian figures at 13:30 BST: Manufacturing Sales and Foreign Securities Purchases.
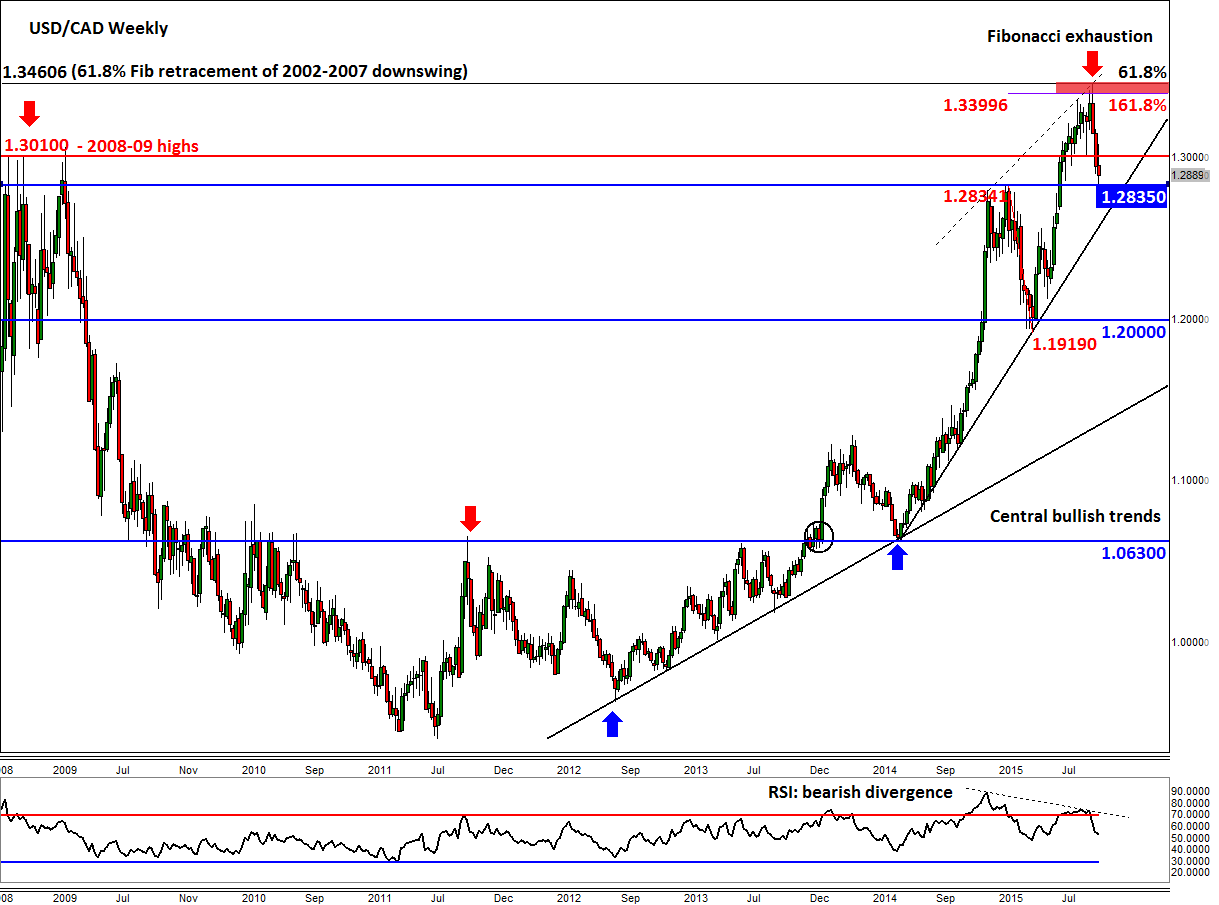
Turning our attention to the technical side of things and there a few interesting developments to take into account. We will begin by looking at the weekly chart, in figure 1. As can be seen, the USD/CAD hit a Fibonacci exhaustion area around 1.3400/60 at the end of September before retreating sharply. This area corresponds with the 61.8% retracement level of the entire 2002-2007 bear trend and the 161.8% extension level of the most recent downswing. The weekly chart also reveals a clear bearish divergence on the RSI momentum indicator, confirming that the bullish momentum was weakening as price approached that exhaustion level. In addition, the Loonie is failing to hold above the 2008/2009 highs of 1.3000/10 which is a further bearish development.
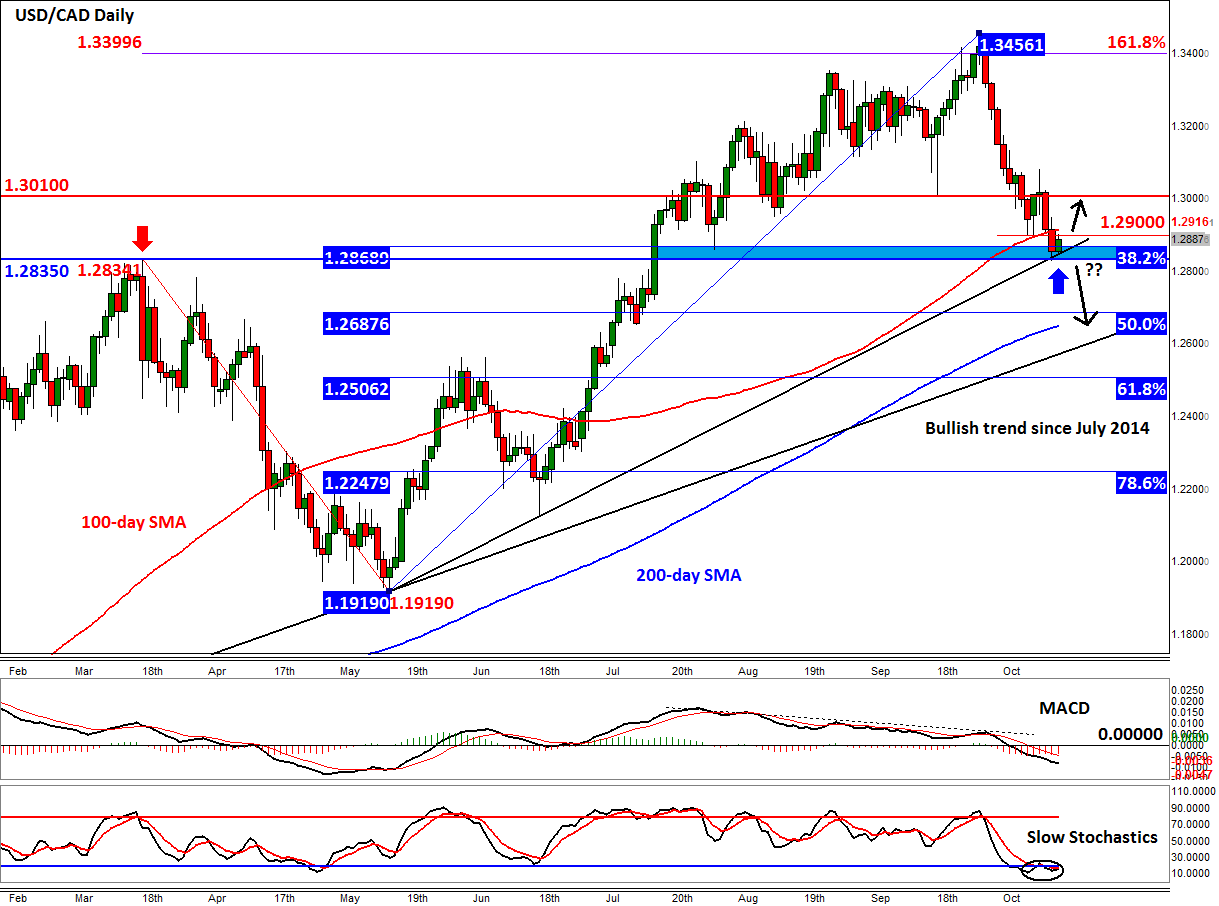
BUT so far the previous resistance and medium term bullish trend line at 1.2830/5 has been defended successfully, as shown on the daily chart. The USD/CAD is now testing the prior support and 100-day moving average around 1.2900. A decisive break above here could see price rally back to 1.3010 before deciding on its next move. The secondary momentum indicators on the daily chart show mixed signals: the MACD is trending below both the signal line and zero, which is bearish, while the slow stochastics point to oversold conditions.
The bears meanwhile will need the USD/CAD to break below the abovementioned support at 1.2830/5 in order to grow more in confidence. If seen, the Loonie may initially drop to the 200-day moving average, currently at 1.2650, before deciding on its next move. Just below this moving average resides the long-term bullish trend line that goes back to July of last year, around 1.2600. Thereafter is the 61.8% Fibonacci retracement level of the last upswing at 1.2505. These levels will be among the short-term bearish targets that we will be watching closely in case the USD/CAD breaks down.