USD CAD Canadian jobs show under the surface strength
While not nearly as widely-watched as the US version (NFP), Canada’s jobs report can nonetheless be a big market mover, especially for the loonie. Unfortunately […]
While not nearly as widely-watched as the US version (NFP), Canada’s jobs report can nonetheless be a big market mover, especially for the loonie. Unfortunately […]
While not nearly as widely-watched as the US version (NFP), Canada’s jobs report can nonetheless be a big market mover, especially for the loonie. Unfortunately for this month’s iteration, the headline reading came in largely as expected: the Canadian economy lost 6.4k jobs in June, roughly in line with the market’s forecast of a 9k decrease in employment. Of course, this month’s report comes in the wake of the stellar May employment report, when a whopping 59k jobs were created in the Great White North.
Digging a little deeper reveals a nuanced picture of the Canadian labor market. The unemployment rate did tick down by 0.1% to 6.8%, but this drop was driven by a falling participation rate (from 65.9% to 65.8%) rather than a strong job growth (as we noted above). That said, the economy actually created 64.8k full-time jobs in June, with the overall negative print caused by a larger drop in part-time employment. Intuitively, the increase in full-time jobs at the expense of part-time jobs creates a more solid base for future economic growth and consumer spending; in other words, the quality of the jobs created was strong, partially offsetting the decline in the quantity of jobs.
Technical view: USD/CAD
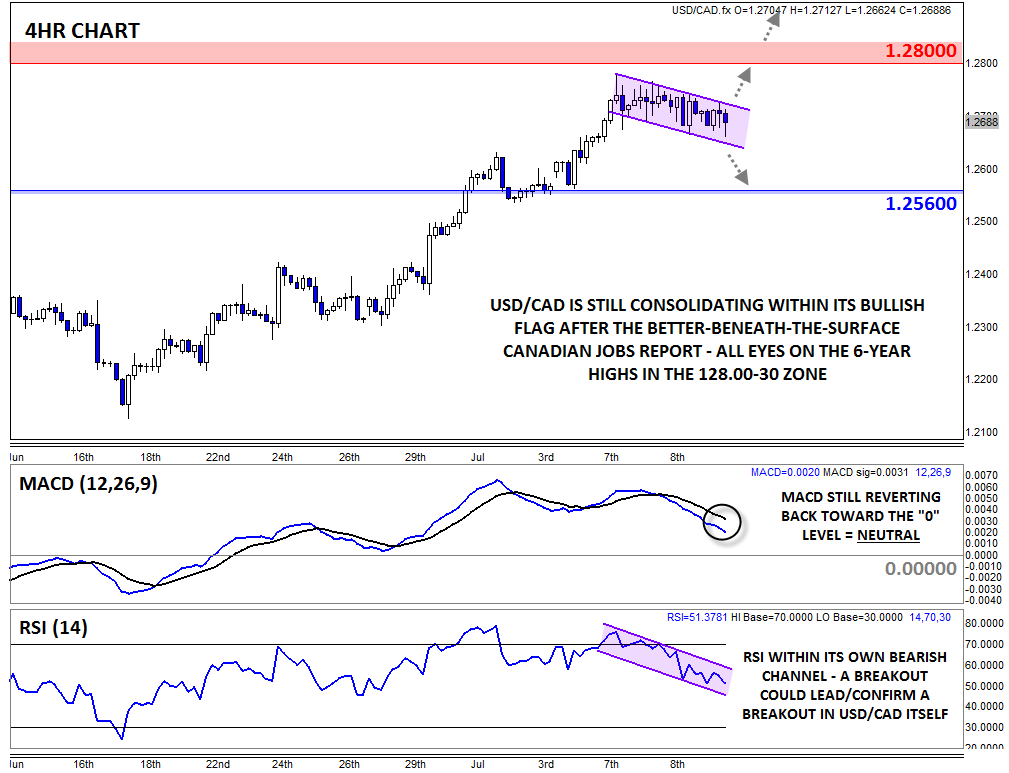
USD/CAD has seen only a minimal reaction to today’s jobs report, with the pair edging about 20 pips lower in the wake of the release. Taking a step back, rates remain solidly in the middle of the recent consolidation zone, which some traders are viewing as a bullish flag pattern. As a reminder, this pattern is created by a strong rally, followed by a shallow, controlled pullback and, despite its name, it is only seen as a bullish if we see a breakout above the top of the flag around 127.50.
For now, more consolidation looks likely as traders await more clarity in the ongoing negotiations in Greece and Iran (with obvious implications for oil, which is Canada’s largest export). The MACD continues to revert back to the “0” level and the RSI indicator is pulling back within its own near-term bearish channel, so astute traders will be watching for a breakout in the indicator’s pattern to lead or confirm a breakout in price itself. If we do see a rally above 127.50, the 6-year high in the 128.00-30 zone may still cap rates, though a move through that resistance zone could expose the 11-year high near 1.30 next. Meanwhile, a bearish breakdown would open the door for a pullback to previous-resistance-turned-support at 1.2560 next.
 Source: City Index


