USD CAD Bear Flag Pattern within Strong Bearish Trend
Price action on USD/CAD (daily chart) as of October 12, 2012, has formed a bearish flag pattern within the context of a strong bearish trend […]
Price action on USD/CAD (daily chart) as of October 12, 2012, has formed a bearish flag pattern within the context of a strong bearish trend […]
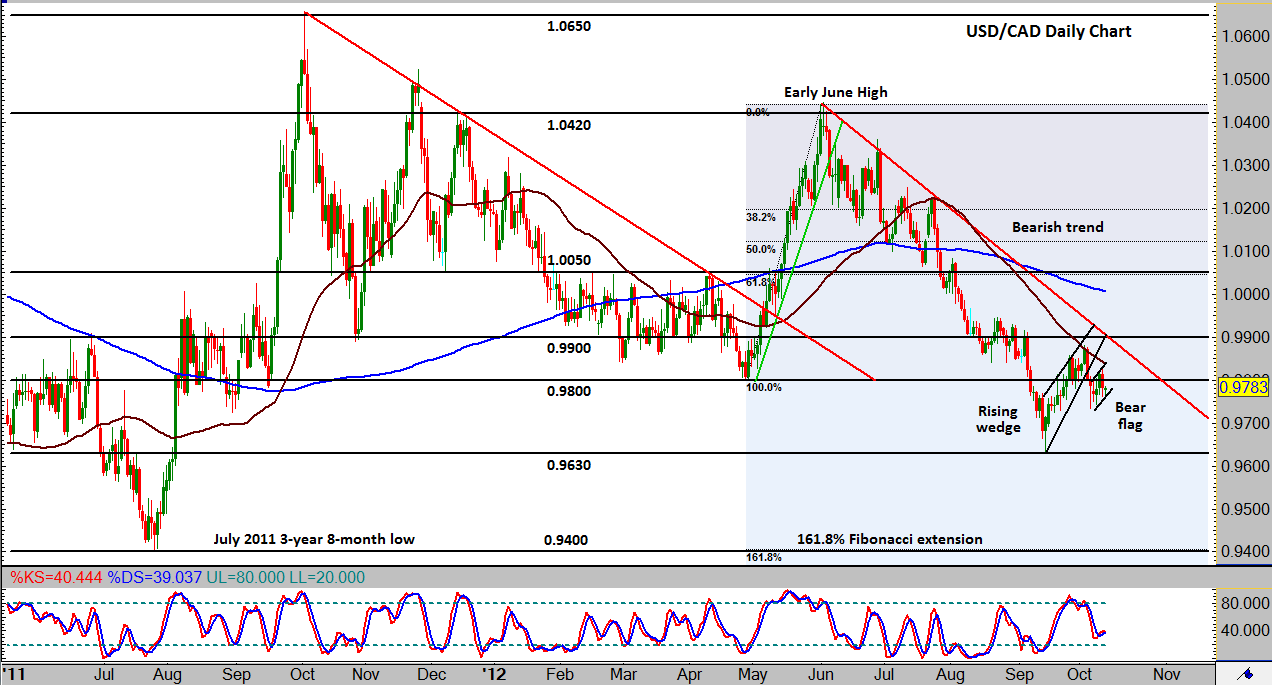
Price action on USD/CAD (daily chart) as of October 12, 2012, has formed a bearish flag pattern within the context of a strong bearish trend that has been in place since the early June high at 1.0445.
This flag consolidation formation occurs after price broke down below a bearish rising wedge pattern last week. That rising wedge can be seen as a bear market rally. If the price is able to stay or return below the 0.9800 price region, a breakdown below the lower border of the inverted flag could trigger enough downside momentum to move towards a re-test of the 0.9630 low hit in mid-September.
Any further break to the downside below that level has the bearish trend potential to move towards the key 0.9400 support level, which not only represents the three-year, eight-month low hit in July of 2011, but also the 161.8% Fibonacci extension of the last major bullish run from late April to early June.