US Stocks turn lower as crude tumbles
US equity markets opened firmer following yesterday’s rebound on Wall Street and in oil prices. However that didn’t last long as crude prices skidded in […]
US equity markets opened firmer following yesterday’s rebound on Wall Street and in oil prices. However that didn’t last long as crude prices skidded in […]
US equity markets opened firmer following yesterday’s rebound on Wall Street and in oil prices. However that didn’t last long as crude prices skidded in reaction to the latest oil inventories data. Nevertheless, the major indices remain in close proximity to their previous multi-year or record highs. This is primarily due to falling government bond yields to repeated all-time lows, which continue to boost the appeal of higher-yield equity markets. In addition, Brexit hasn’t severally dented the appetite for global stocks, which is important to note. But the equity markets will probably need the slumping oil prices to turn back higher and climb above $50 again at some stage before we potentially see new highs for the likes of the S&P 500. I think it is just a matter of time before that happens. That being said, traders will need to proceed with extra care for now as the S&P 500 and Dow Jones test or approach the top of their two-year ranges.
Crude tumbles on lower-than-expected oil inventory draw
Last night, the American Petroleum Institute (API) has reported a sharp draw of 6.7 million barrels in US crude oil inventories, which was the seventh consecutive decline. In addition, the API estimated that stocks of oil products fell sharply too with gasoline inventories dropping by a good 3.6 million and distillates by 2.3 million barrels. This had raised expectations that the official crude oil inventories data from the Energy Information Administration (EIA) today would show a significantly larger decline than the 2.1 million draw expected. Well as it turned out, the EIA reported numbers that were basically below expectations on nearly all fronts, except production which showed a weekly decline of 2.25 per cent, the biggest since September 2013. The rest of the figures were poor relative to expectations: total US crude stocks fell by 2.2 million and Cushing stocks declined by 0.82 million, while gasoline inventories edged lower by 0.1 and distillates by 1.5 million.
Technical outlook: S&P 500
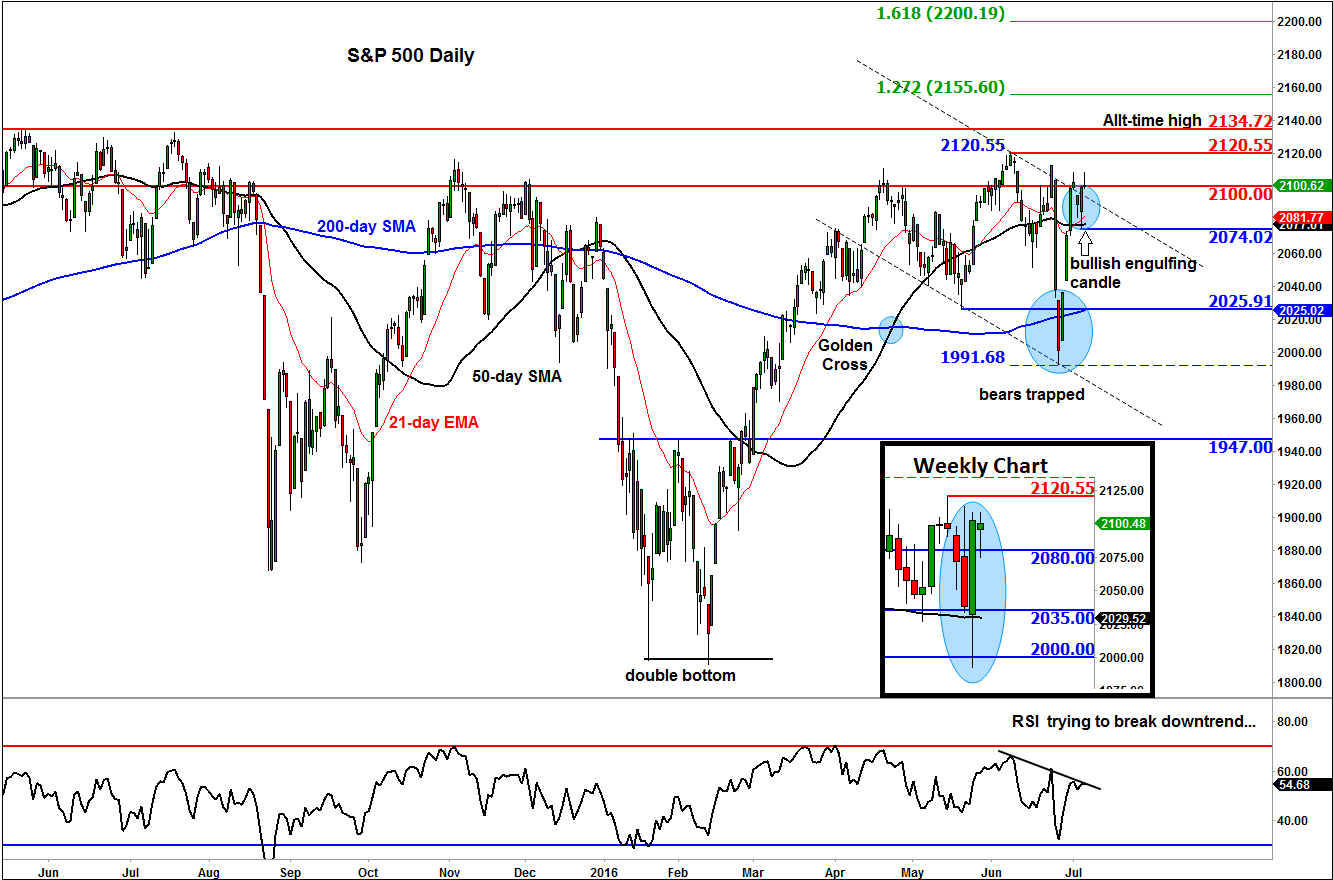
As crude oil tumbled, US stock indices struggled to regain their earlier momentum. Still, the technicals paint a bullish picture. Take the S&P 500 as an example. As can be seen in the inset, the index formed a large bullish engulfing-like candle on the weekly time frame as traders shrugged off the Brexit vote last week. This looks like a v-shaped recovery on the main daily chart, which also shows a bullish engulfing candle off of the 50-day moving average. Together, these indications suggest that the index may soon climb outside of the bull flag, which is a continuation pattern. If confirmed by a decisive break above the pivotal 2100 level then it could be a matter of time before we see at least a test of the prior record high at the 2134/5 area.
At this stage, only a closing break below 2074 support, or the low from yesterday, would invalidate this short-term bullish outlook. The slightly longer term outlook would turn bearish upon a break below the 200-day average and support at 2025/6 area.