


January 4, 2021 2:53 PM
US stocks fall out of bed on first day of year, pushing US Dollar higher: S&P 500, GBP/USD, AUD/USD
The US stock market opened the year like a bat out of hell and quickly sold off 120 handles from its all-time highs overnight at 3773.25 to current intraday lows at 3652.50. The S&P 500 is currently holding the upward sloping trendline from back in January 2018, near todays lows. The US Dollar Index has been trading inversely with the S&P 500 since stocks made pandemic lows on March 23rd. The current correlation coefficient between the S&P 500 and the US Dollar Index (DXY) is -.60. So, as the S&P 500 falls, the DXY goes bid.
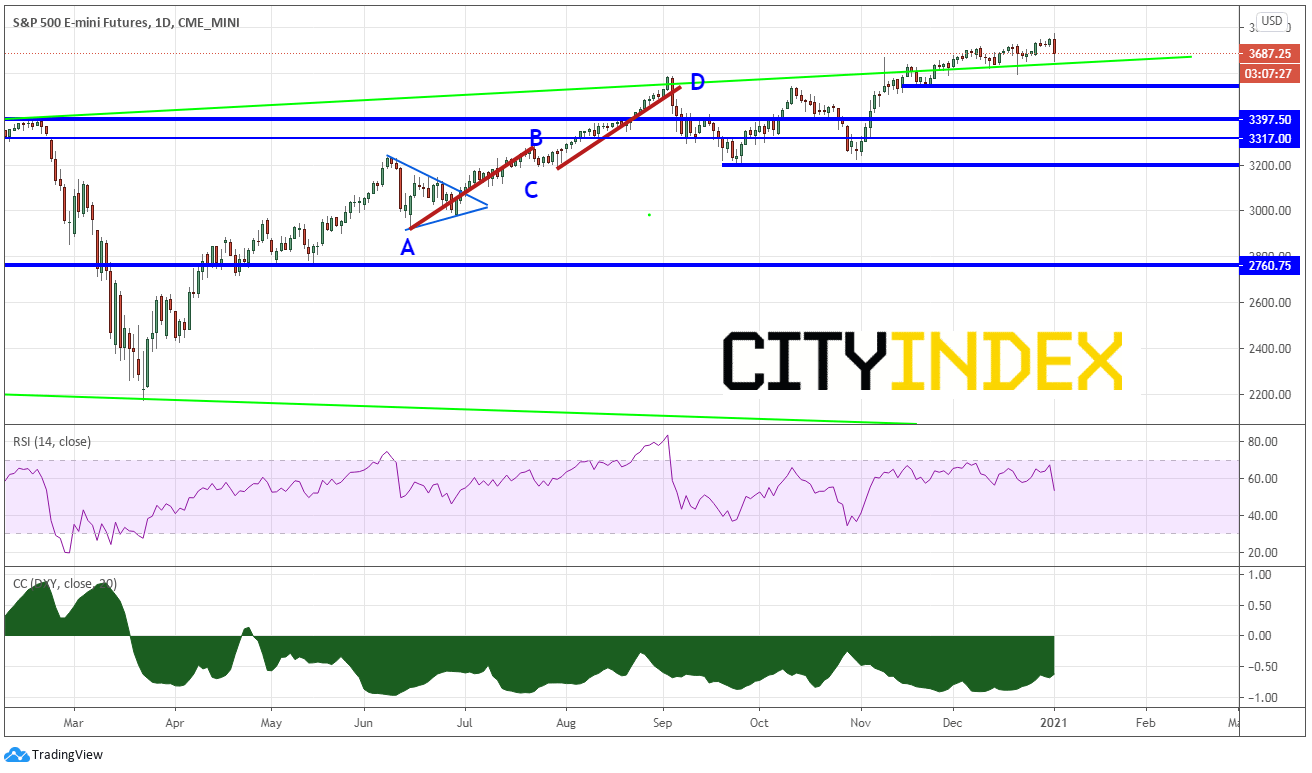
Source: Tradingview.com, City Index
The Pound vs the US Dollar had been moving higher into the end of the year. The pair broke out of its upward sloping channel on December 30th, where it has been since September, only to run into horizontal resistance at 1.3700. GBP/USD moved back into the channel today on the strength of the US Dollar. The RSI had put in 3 lower highs as price put in 3 higher highs, an indication price may turn lower.
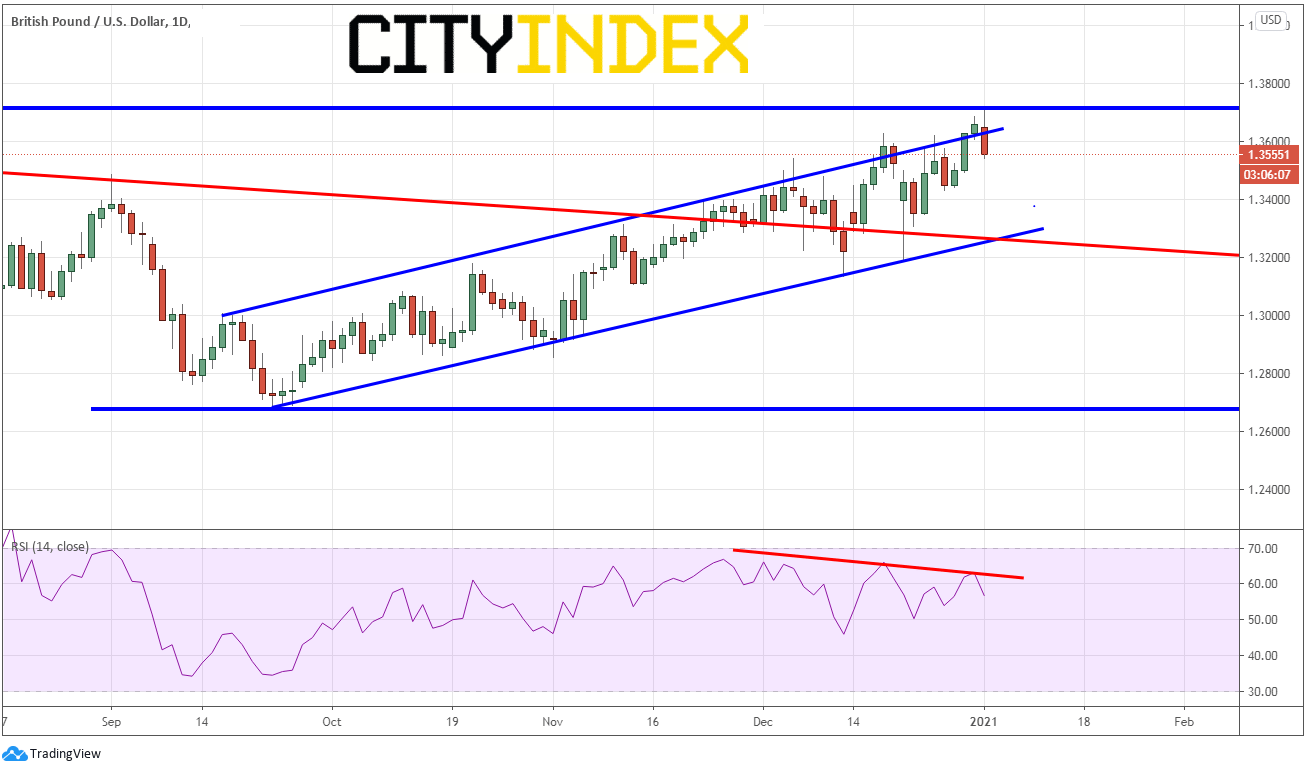
Source: Tradingview, City Index
On a 60-minute timeframe, GBP/USD has pulled back to horizontal support just above the 61.8% Fibonacci retracement level from the December 28th lows to today’s highs. Buyers may be looking to enter the market at the lows near 1.3541 and the 61.8% level near 1.3520. Horizontal support is at 1.3469 and 1.3429. Intraday resistance above is at 1.3620 and the day’s highs near 1.3703.
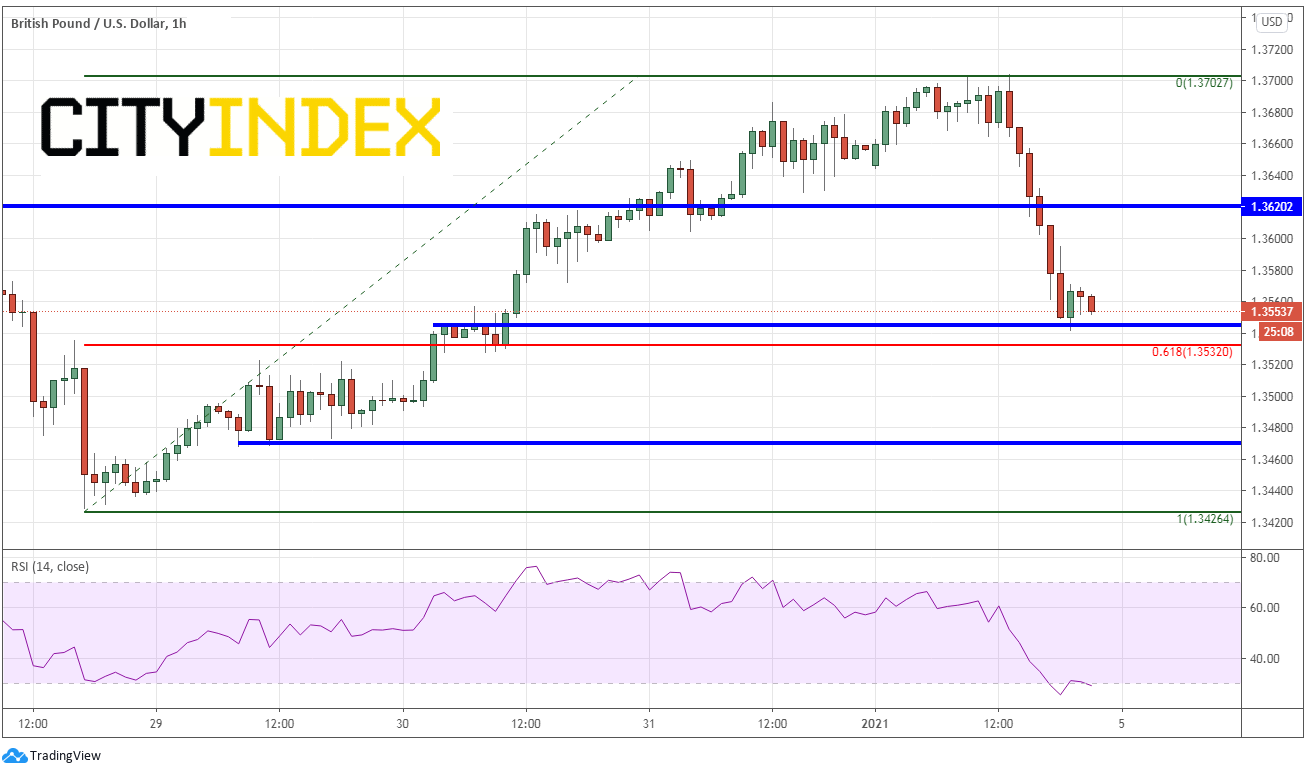
Source: Tradingview, City Index
AUD/USD has been moving aggressively higher since moving November 2nd as price held 0.7000. On December 31st, 2020, AUD/USD formed a shooting star candlestick just above the 161.8% Fibonacci extension from the highs of September 1st to the lows of November 2nd, near 0.7677. The RSI was also diverging with price. Today, price moved lower, back below the 161.8% Fibonacci level.
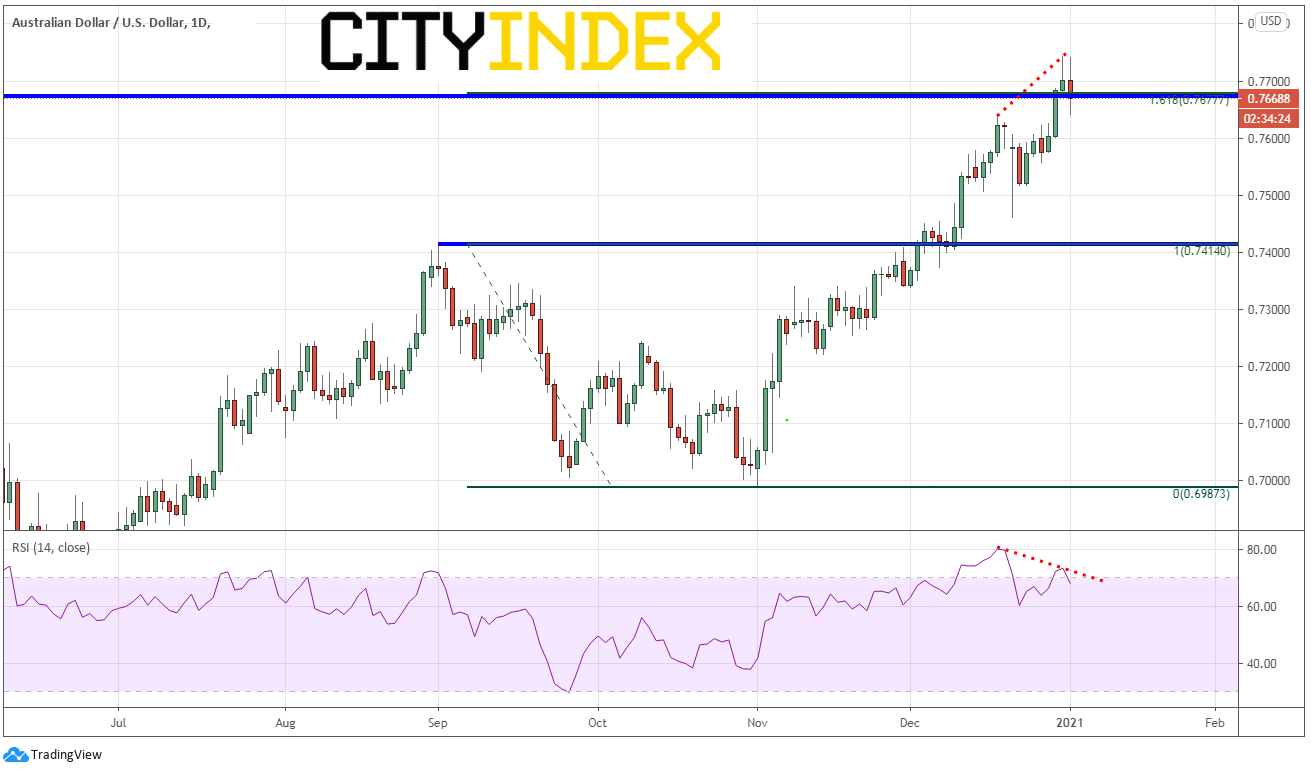
Source: Tradingview, City Index
On a 60-minute timeframe, AUD/USD formed a double to near 0.7740 and broke the neckline at 0.7681. The target for a double to is the height of the pattern added to the breakout level, which comes in near horizontal support at 0.7622. Watch for buyers to enter there who may wish to take advantage of the dips. Resistance is at the double top neckline near 0.7681 and today’s highs at 0.7740. Horizontal support below is at 0.7554, 0.7518, and 0.7461.
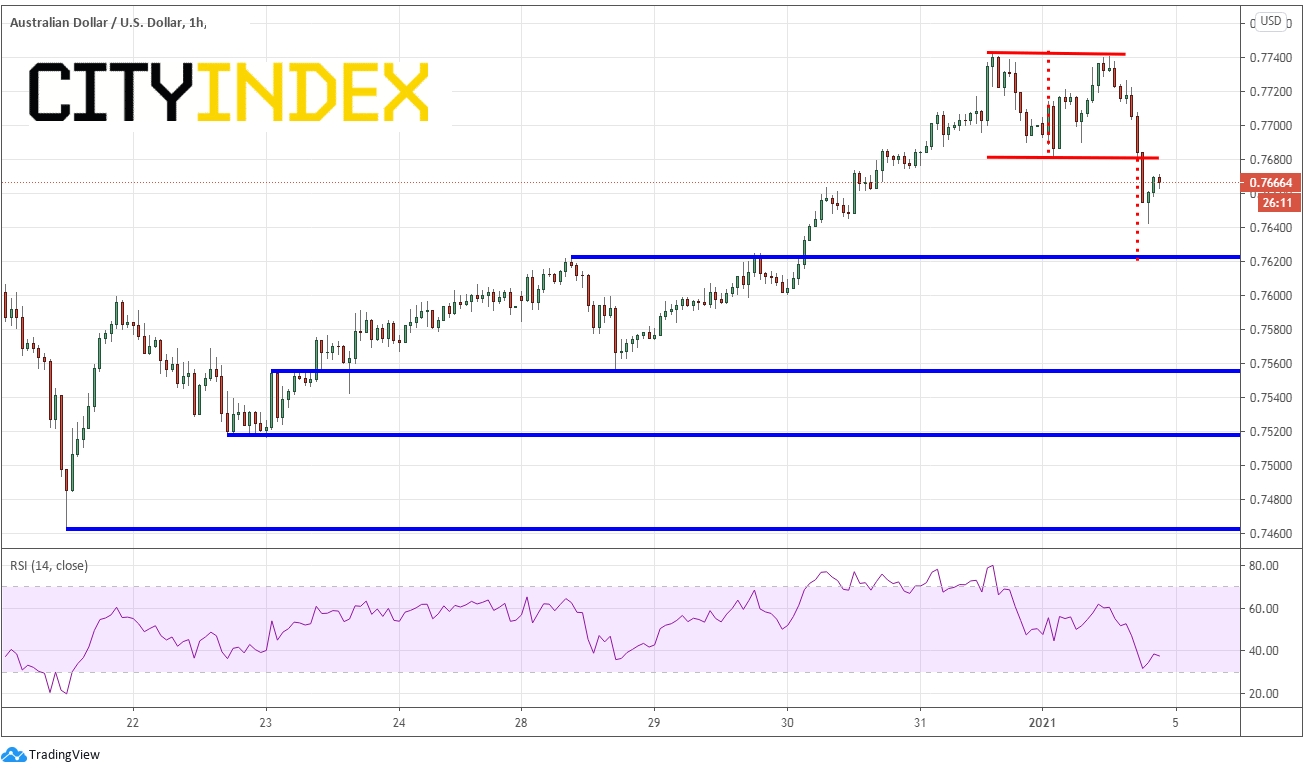
Source: Tradingview, City Index
There are any number of reasons stocks could have sold off today, but the point to remember is that when stocks move in one direction, the DXY is currently moving in the other direction.
Learn more about forex trading opportunities.
Learn more about index trading opportunities.Latest market news
Today 08:33 AM
Latest Forex articles
Yesterday 04:47 AM
April 16, 2024 12:00 PM
April 16, 2024 04:24 AM