


FedEx (FDX)
click to enlarge charts
FedEx will announce its Q4 fiscal year earnings ended May 2019 later today, 25 Jun after the close of the U.S. session. Based on data from Refinitiv, analysts have estimated its earnings per share (EPS) to come in at 4.85 which is 18% below the similar quarter a year ago. Below are some key fundamental quick facts before we dive into the technical analysis of FedEx:
- In the previous Q3 fiscal year earnings ended Feb 2019, its actual EPS came in at 3.03 which as below expectations by -2.67% against a mean estimate of 3.11.
- Earnings have been projected lower due to headwinds from slower global economic that will impact its transportation business due to on-going trade tensions between U.S. and China.
Key technical elements
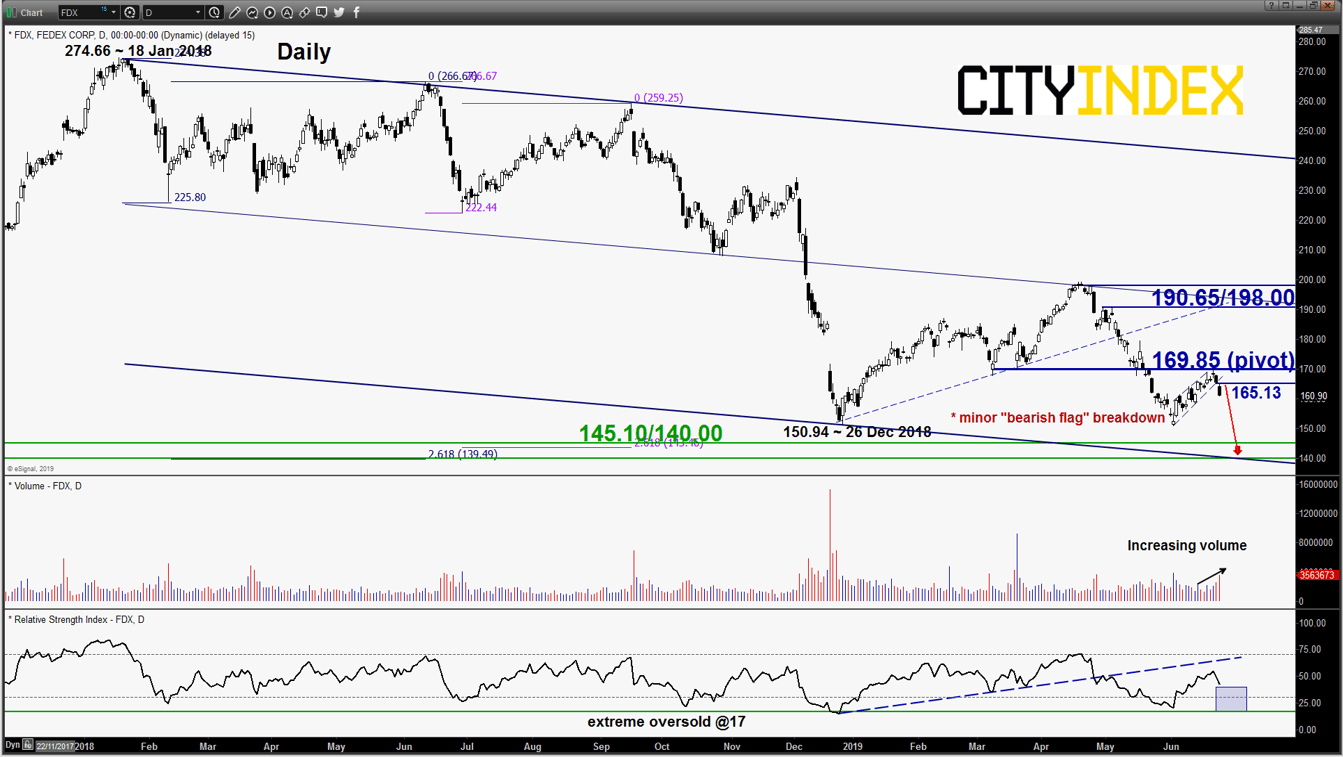
- In yesterday’s 24 Jun U.S. session, the share price of FDX has staged a breakdown from the minor “bearish flag” ascending range configuration in place since 03 Jun 2019 low of 150.68 now turns pull-back resistance at 165.13
- The breakdown from the minor ‘bearish flag” has been accompanied by an increased in volume versus its 10-day average volume since 03Jun 2019 low.
- Medium-term price momentum remains negative as indicated by the daily RSI oscillator.
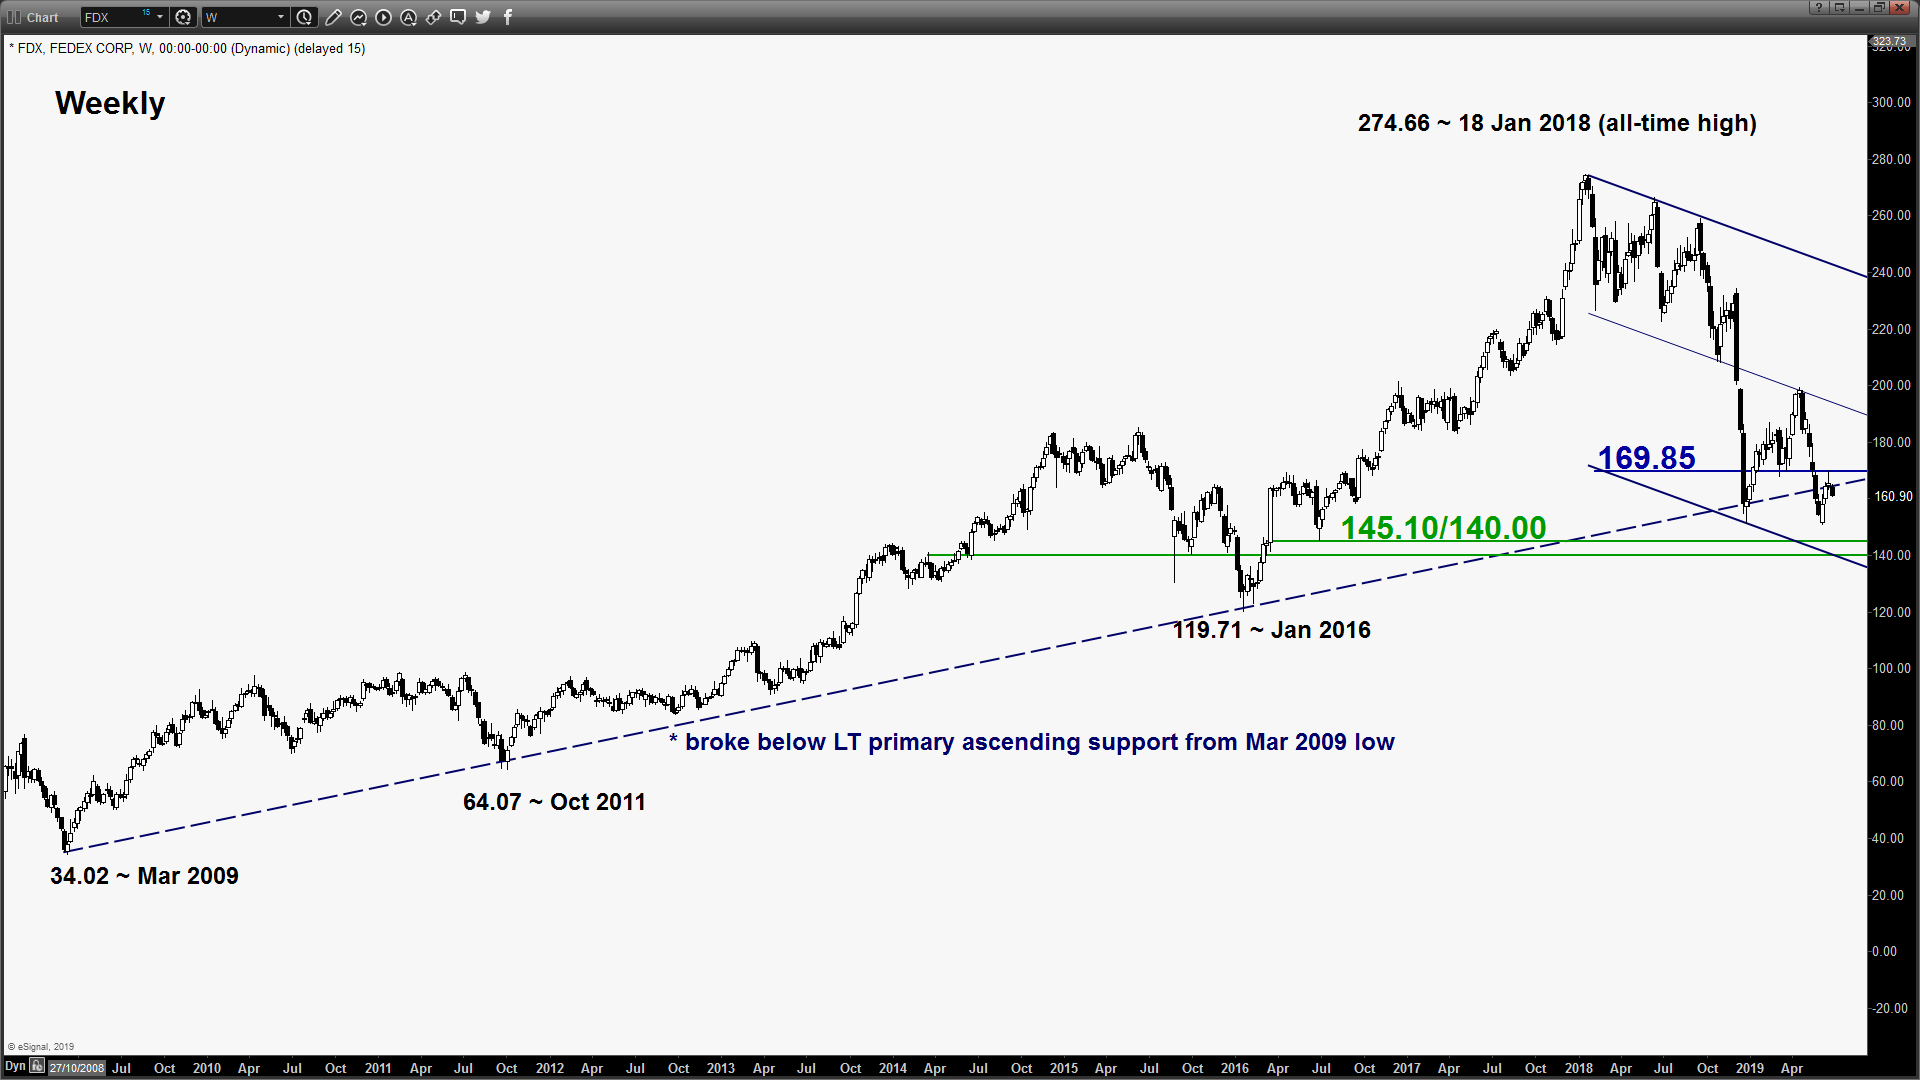
- The key medium-term resistance stands at 169.85 which is also the pull-back resistance of the former long-term primary ascending support from Mar 2009 low.
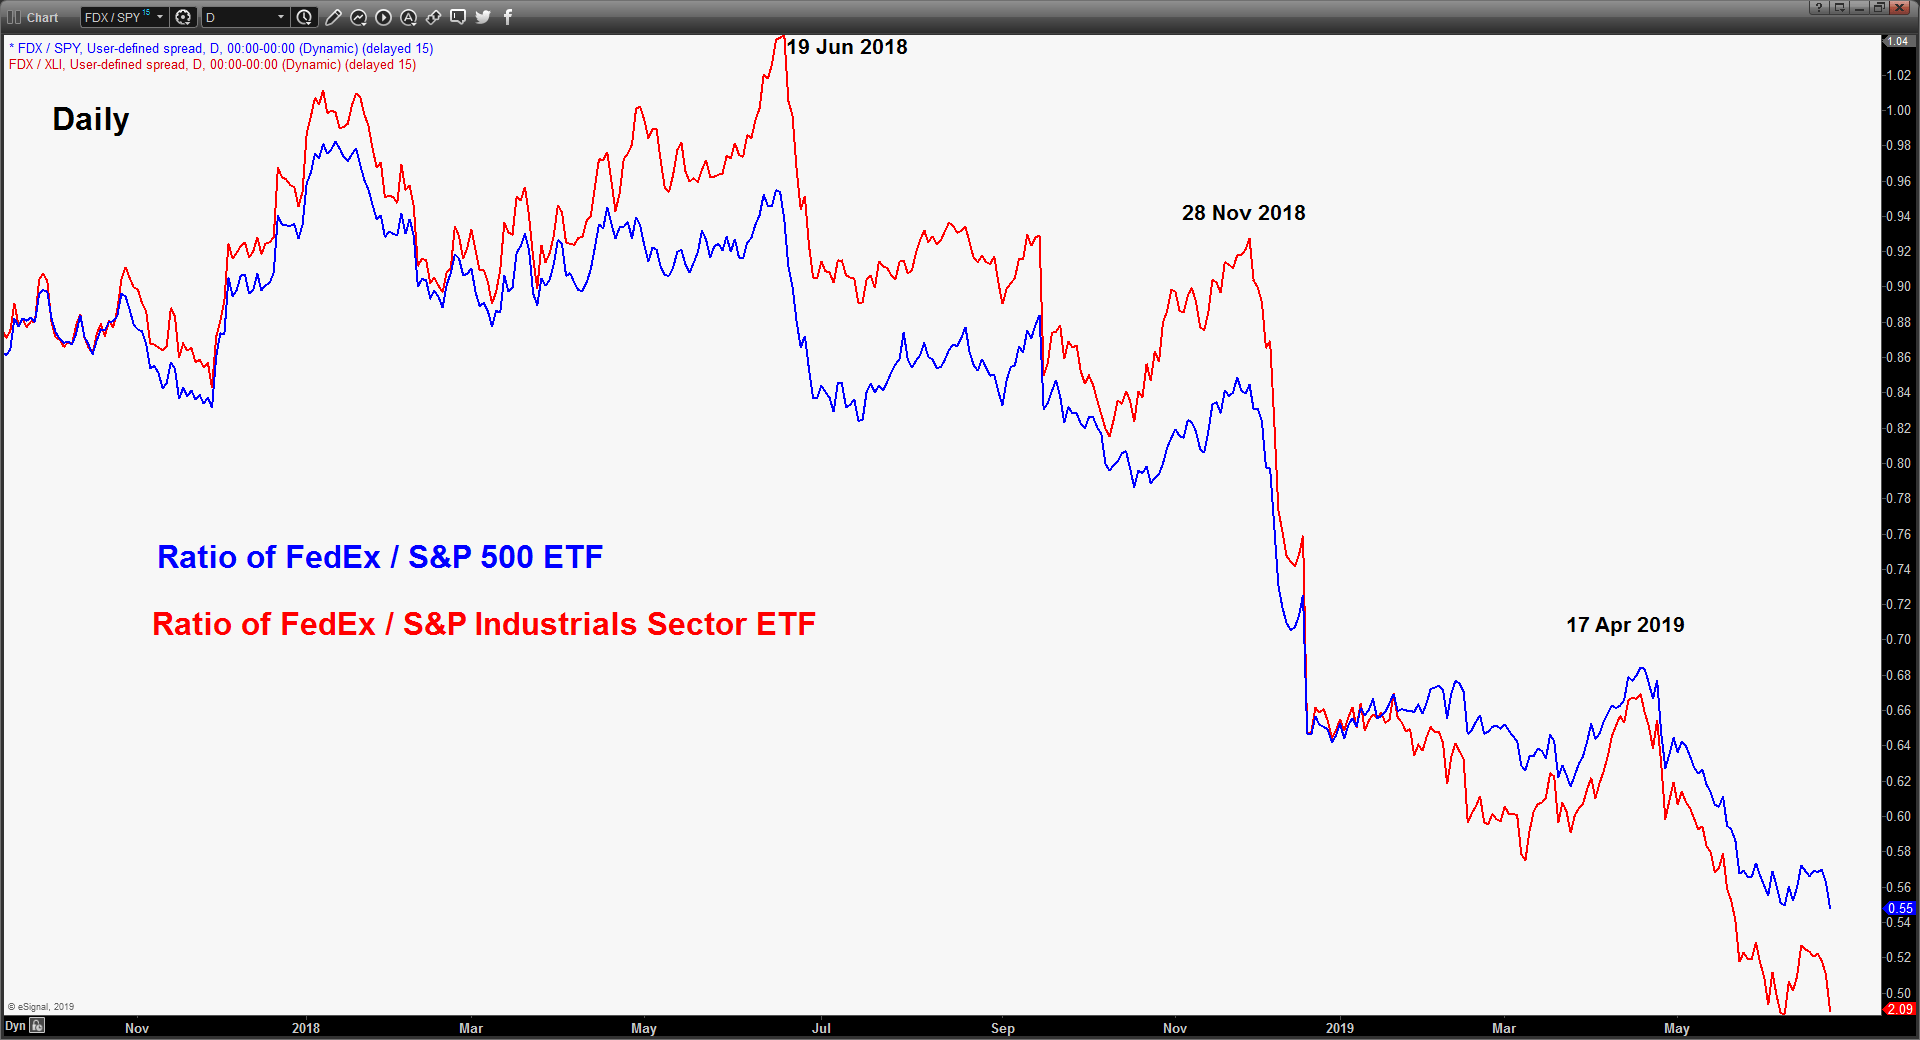
- Relative strength analysis from the ratios of FDX against its industry sector (S&P Industrials XLI) and the U.S. benchmark stock index (S&P 500) have continued to exhibit medium-term weakness/underperformance.
Key Levels (1 to 3 weeks)
Intermediate resistance: 165.13
Pivot (key resistance): 169.85
Support: 145.10/140.00
Next resistance: 190.65/198.00
Conclusion
If the 165.13 key medium-term pivotal resistance is not surpassed, FDX is likely to see the start of another impulsive downleg sequence to target the next significant medium-term support zone at 145.10/140.00 (also a Fibonacci expansion cluster).
However, a clearance with a daily close above 169.85 invalidates the bearish scenario to kick start a corrective rebound sequence towards the next resistance at 190.65/198.00 (also the median line of the major descending channel in place since 18 Jan 2018).
Charts are from eSignal
Latest market news
Today 11:14 AM
Today 08:28 AM
Yesterday 03:30 PM
Latest Shares market articles
November 2, 2023 01:41 PM
November 1, 2023 01:33 PM
October 31, 2023 01:15 PM
October 31, 2023 10:24 AM