US small cap share ratio may tip the balance
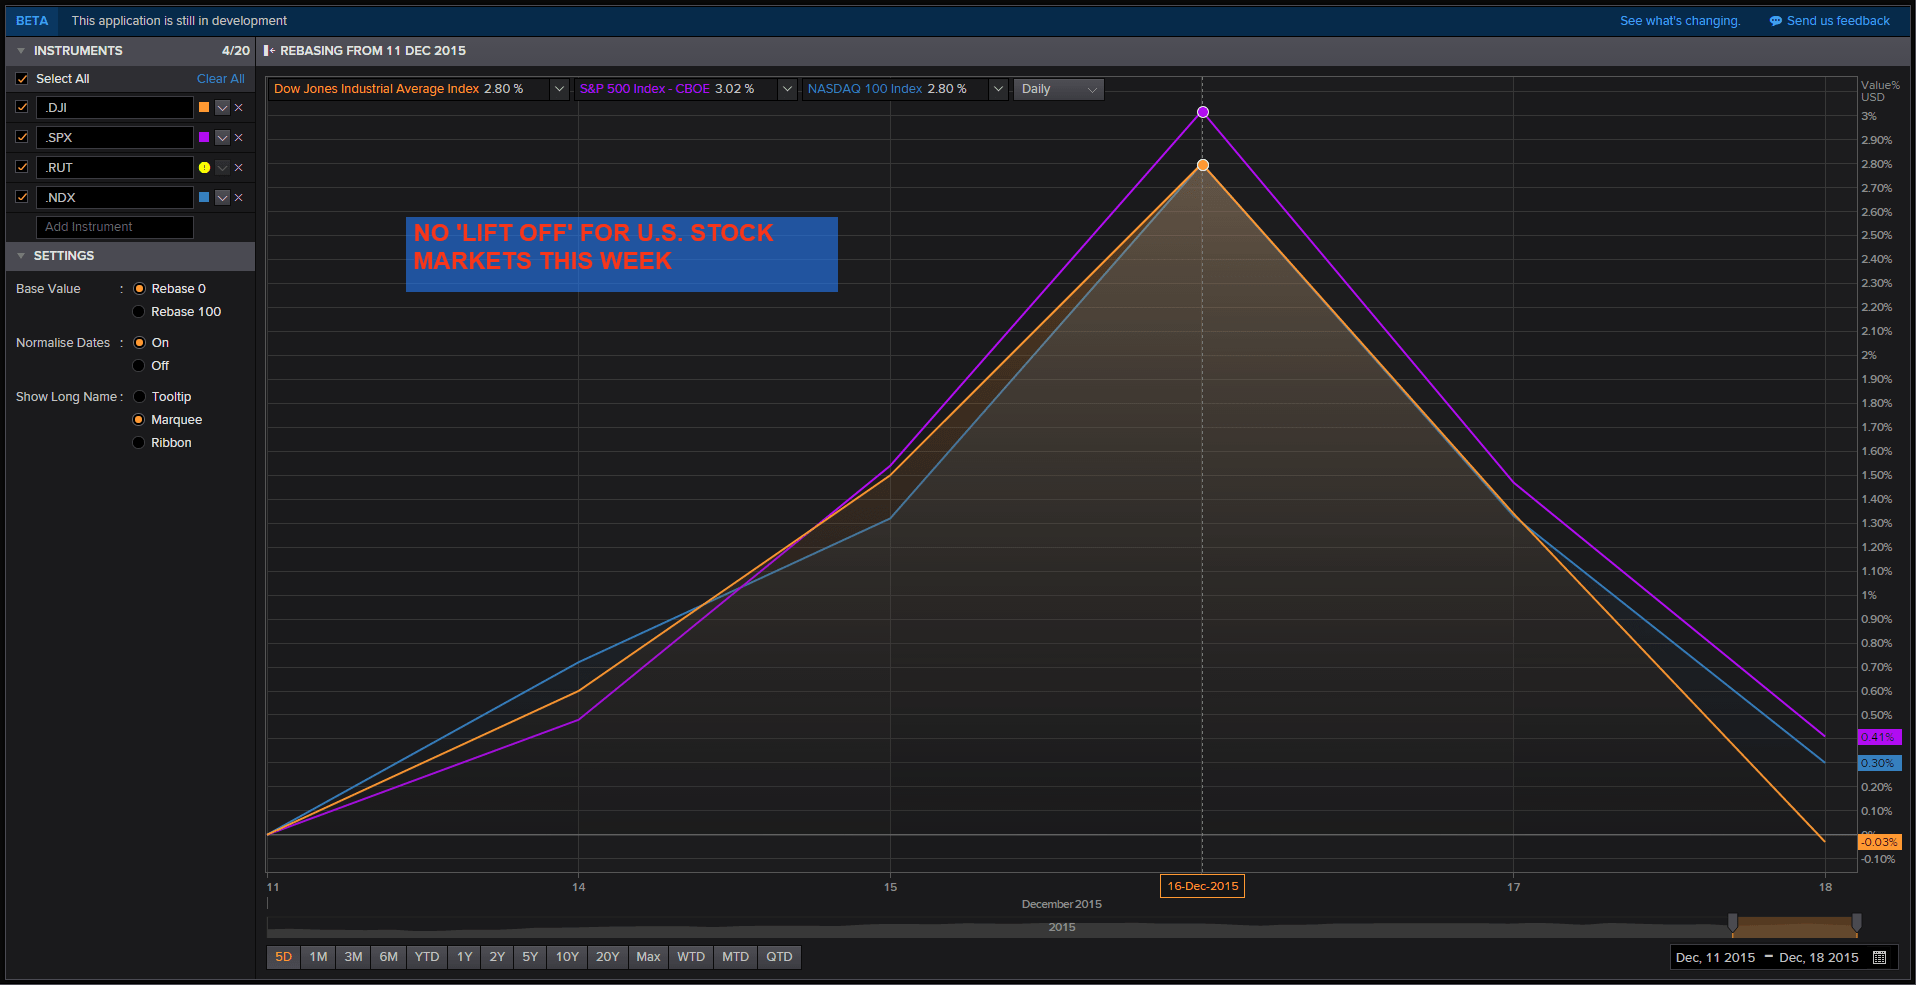
It’s fair to say the performance of US stock markets in the wake of Wednesday’s Federal Reserve interest rate ‘lift-off’ has been anything but straightforward. […]
It’s fair to say the performance of US stock markets in the wake of Wednesday’s Federal Reserve interest rate ‘lift-off’ has been anything but straightforward. […]
It’s fair to say the performance of US stock markets in the wake of Wednesday’s Federal Reserve interest rate ‘lift-off’ has been anything but straightforward.
After rising to a five-day peak in the days before the big event, US stocks on aggregate were either sitting on thin gains by Friday, or in the case of the Dow Jones Industrial Average, toying with a loss.
Please click image to enlarge
The most obvious explanation as to why stocks responded so ambivalently is that once the main news of the week—which did not contain any material surprises—was out of the way, markets resumed the debate about how to price-in the biggest loss of value in natural resources in modern times.
That and a resurgent dollar which pretty much shrugged off any dovish hints from the continued “accommodation” stressed by the Federal Reserve on Wednesday.
The greenback’s implied erosion of corporate earnings and definite headwind for dollar-denominated commodities is moot.
Having said that, there is an additional factor that has been playing on the minds of US equities investors over recent months: the matter of ‘market breadth’.
Generally speaking, there have been several indications that the balance of strongly performing stocks compared to the weak has gone awry.
Fewer stocks have been leading more of the market higher than is generally regarded as healthy.
One particular concern of late has been a similar kink in the structure of the US’s smaller-cap stock markets.
Investors often scan the Russell 2000 (RUT) and Russell 1000 (RUI) indices for signs of divergence from larger companies listed in gauges like S&P 500.
As well, imbalances between RUT and RUI themselves have often preceded important market milestones.
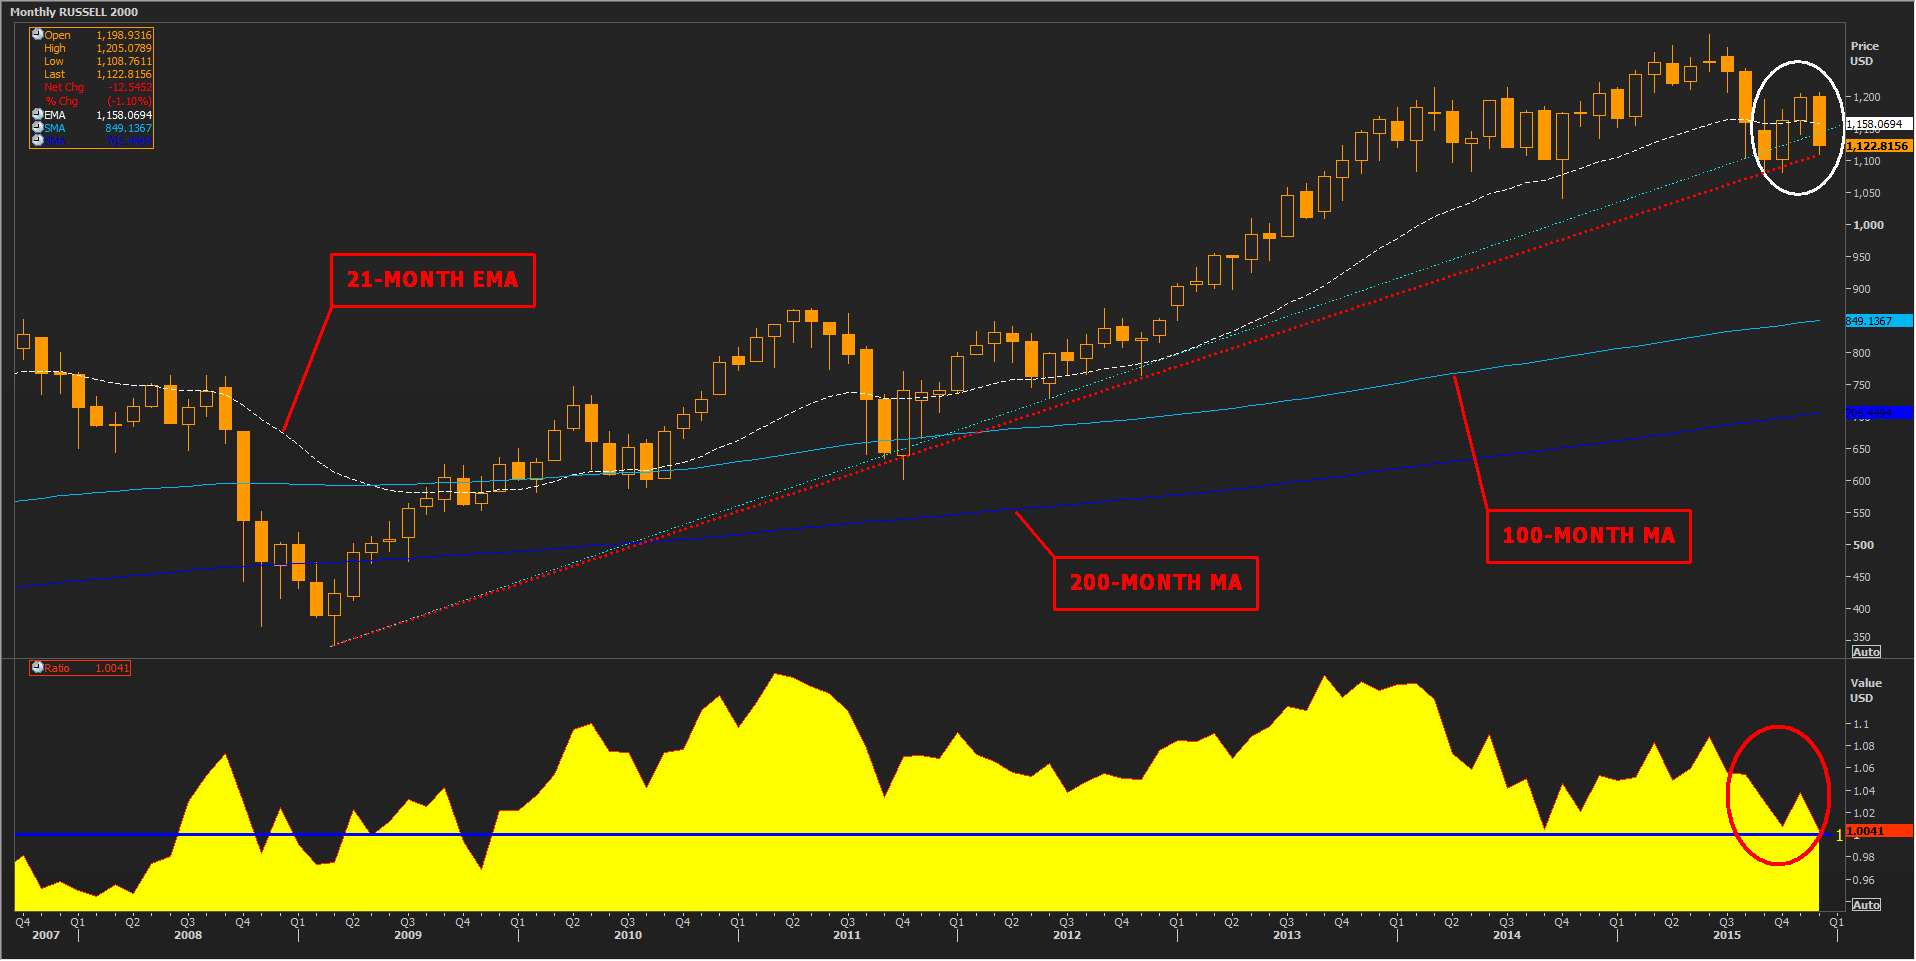
On Tuesday, a simple ratio between the pair looked like it could close below the 1.00 reading for the first time since December 2009.
It recovered later in the week though was still sitting close to its lowest for 18 months as this article went online.
That meant the performance of Russell’s smallest capitalised stocks was wilting.
Typically when RUT makes new highs and the ratio diverges it can warn of potential market instability.
For example, between late October 2013 and this year, the ratio stayed beneath its early 2011 peak.
But it then diverged sharply in June.
Russell 2000 went on to lose 17% before bottoming in late September and Russell 1000 lost almost 13%.
Of course they can both rise even if the ratio is falling.
But a weakening Russell 2000 relative performance can signal a build-up of risk-aversion.
So what might the RUT/RUI ratio be signalling now?
One can never be too sure about such things.
For US small caps, the ratio dip coincides with a similarly dwindling balance of ‘advancers’ versus ‘decliners’ among ‘big tech’ stocks.
RUT has been stuck within touching distance of its September lows all week and was about 3% off them at time of writing.
And of course, RUT is among the few major indices that has not conquered its important 200-day moving average.
The monthly chart (pictured) shows Russell’s tightest uptrend since 2009 has been broken, although a slightly shallower one remains intact.
For the near term, investors would be wise to watch both the ability of Russell 2000 to remain above its long-term rising trends, and whether the ratio between it and its lesser cousin dips below 1.00.
Please click image to enlarge
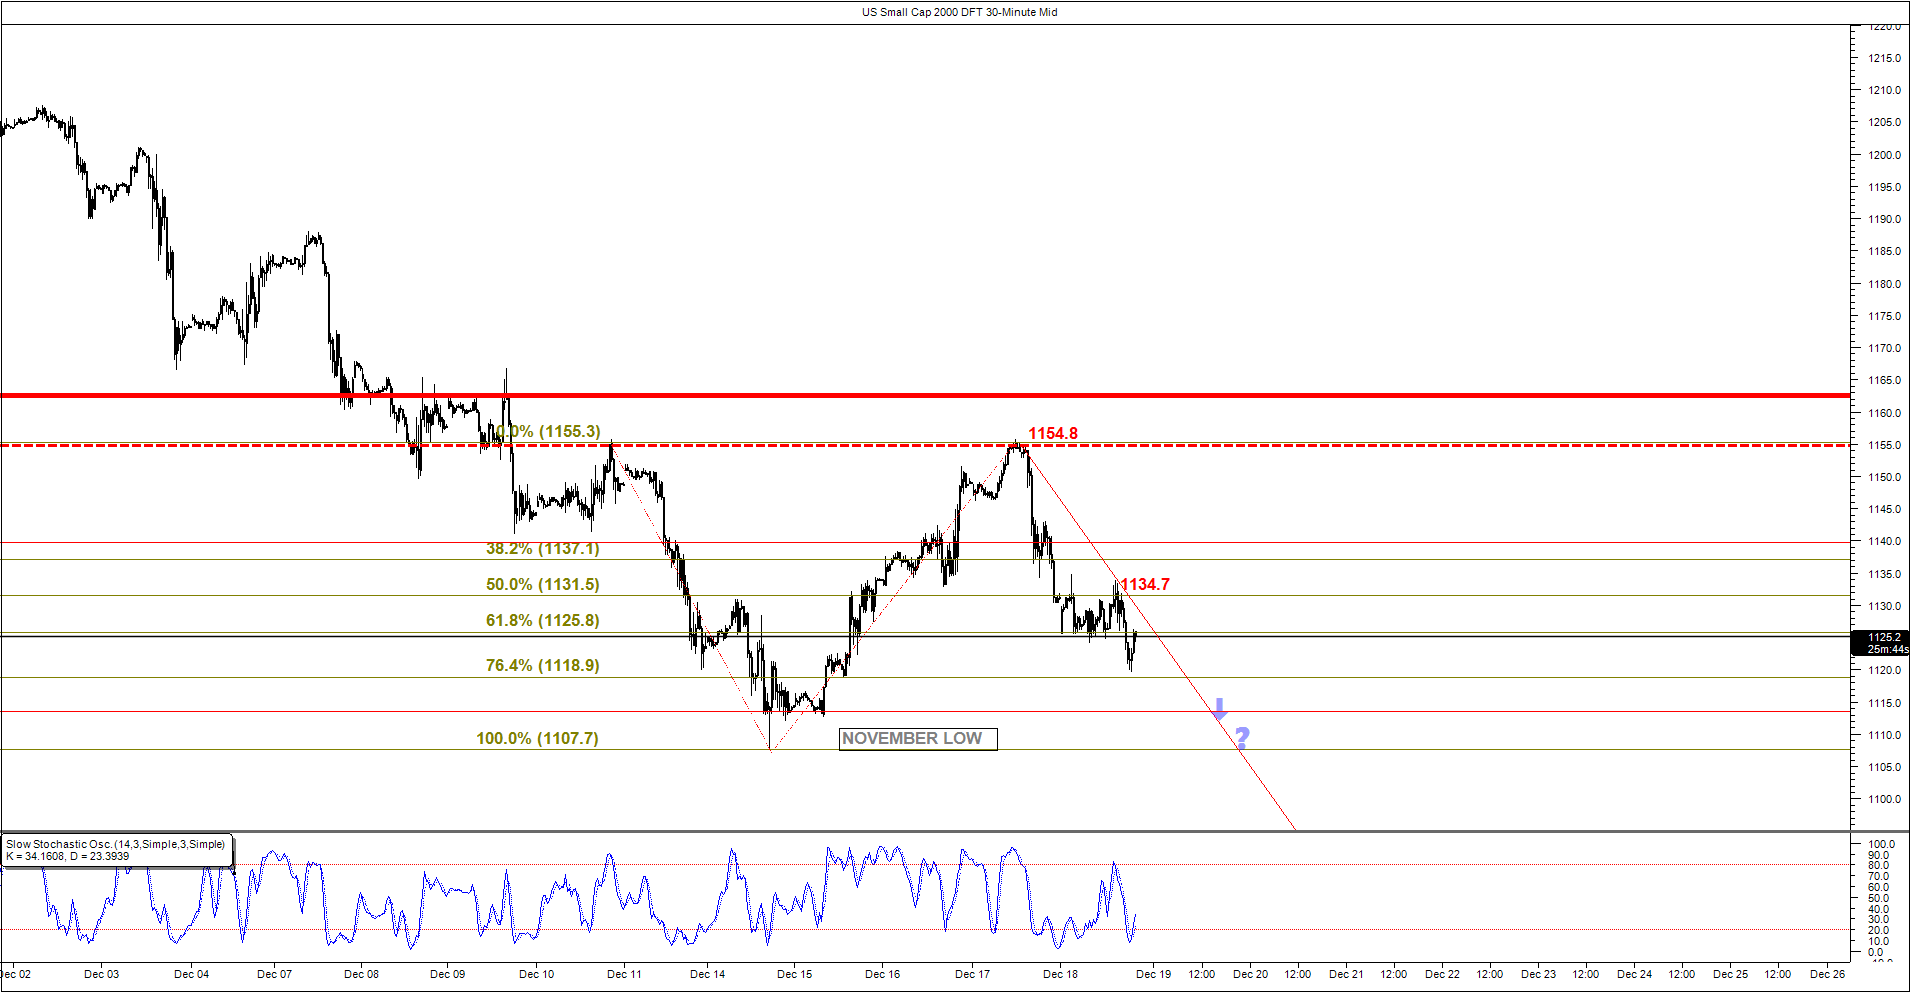
Active traders of the main Russell index by means of City Index’s US Small Cap 2000 Daily Funded Trade (DFT) on Friday backed off an attempt to break above a sharply descending line representing RUT’s post-Fed slide.
In the half-hourly view, that left a 76.4% (1118.9) extension as possible support which was on the verge of being tested at online time.
It is drawn off this week’s second failed attempt to get above 1154 (blame the Fed.)
Beneath 1118.9 lay proven 14th/15th December support at 1113, before completion of the extension at November’s low at 1107.
Overwound downside momentum (see sub-chart of the Slow Stochastic Oscillator) didn’t seem to favour destruction of all possible supports mentioned above.
But the very weak overall tone in this short-term picture didn’t seem to offer much reassurance for bottom pickers either.
Please click image to enlarge
