


December 10, 2021 4:58 PM
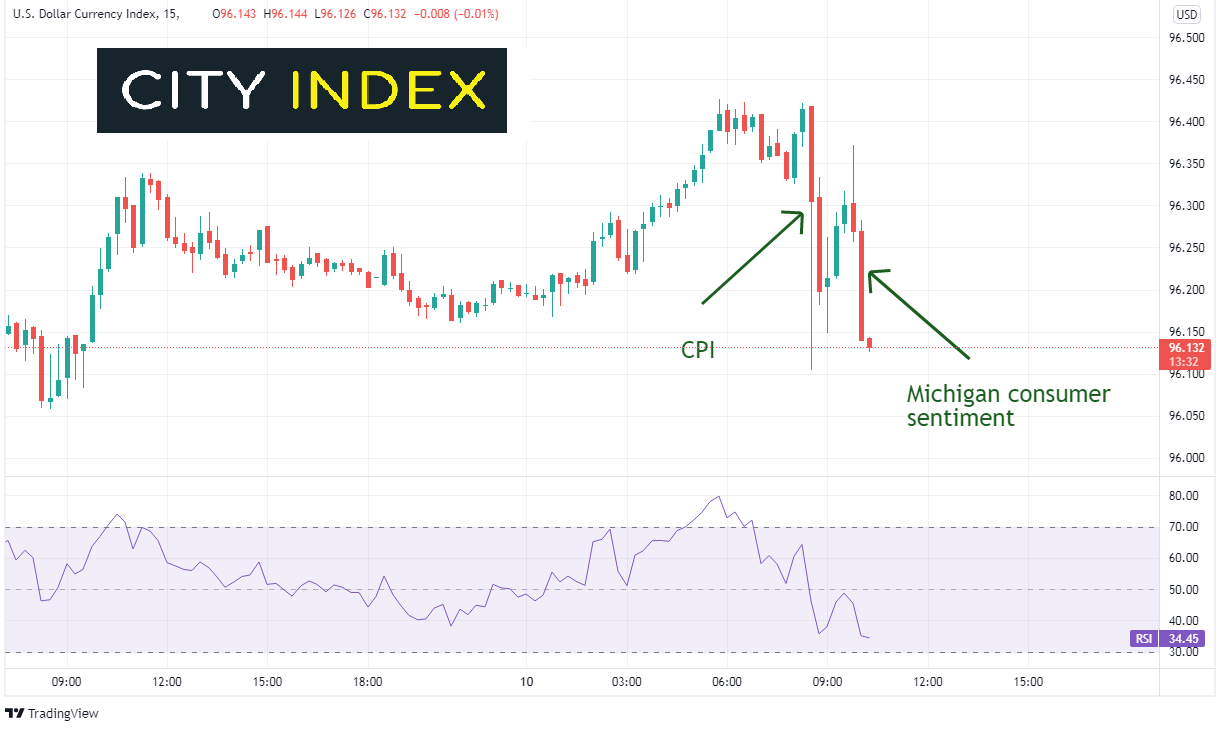
US November CPI was going to be the highlight heading into this week, and it did not disappoint. The headline print was 6.8% YoY vs 6.2% YoY in October, in line with expectations. This was the highest print since June 1982 when it printed 6.8%! Core CPI, which excludes food and energy, was higher as well, at 4.9% YoY vs 4.6% YoY in October. The December preliminary Michigan Consumer Sentiment was also released today. The 1-year inflation expectation component was 4.9%, unchanged from November. The 5-year inflation expectation component was 3%, also unchanged from November. The good news is that these numbers have not gone up. The bad news is that the Fed targets 2% inflation!
Logic may have one think that the US Dollar should go bid on the release of these data prints. However, on a 15-minute timeframe, the DXY moved lower on the release of the data:
Source: Tradingview, Stone X
Trade the DXY now: Login or Open a new account!
• Open an account in the UK
• Open an account in Australia
• Open an account in Singapore
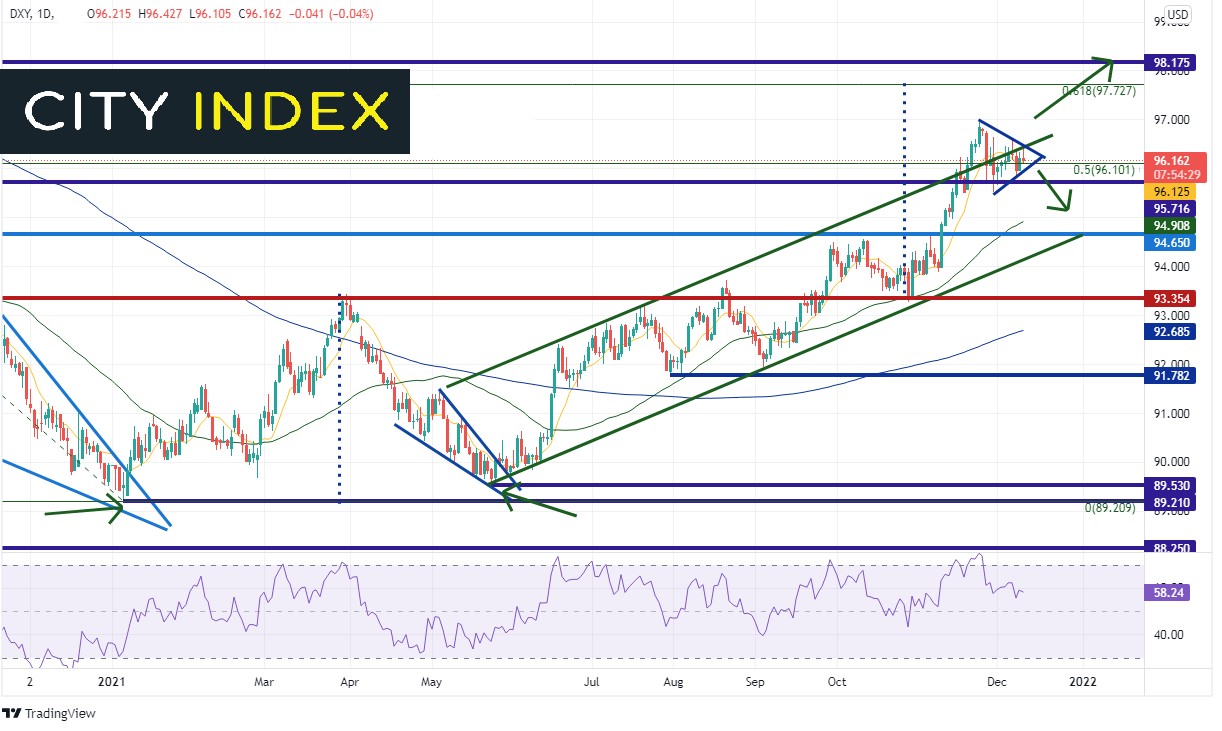
Was this a “Buy the rumor, sell the fact” trade today with “in-line” expectations ahead of the FOMC meeting next week. The DXY has had a large move higher since making a double bottom earlier in the year near 89.20/89.50. The target for the double bottom is near 97.72. The DXY recently reached a high of 96.94 on November 24th, therefore, it still has some room to go on the upside if price is going to move to target. However, price did have a false breakout above the upward sloping channel the index has been in since the May lows. Often, when price fails on the breakout of one side of a channel, it moves to test the other side of the channel, which is currently near 94.65. First support is just above there at the 50-Day Moving Average near 94.90. Strong horizontal support below the trendline is at 93.35.
Source: Tradingview, Stone X
As the same time, the DXY is nearing the apex of a symmetrical triangle and the 50% retracement of the move from the highs of March 2020 to the lows of January. The price action would suggest a break higher out of the triangle. If price breaks above 96.50, first resistance is at the November 24th high of 96.94 and then the 61.8% Fibonacci retracement from the aforementioned timeframe at 97.72 (also the target for the double bottom). Horizontal resistance above there is at 98.17.
Now that all the notable inflation data has been released ahead of next week’s FOMC meeting, the direction of the US Dollar Index may depend on their decision. If the FOMC increases the pace of tapering its bond purchases, the US Dollar may go bid. If they keep the current pace of bond buying, the DXY may pull back. Until then, watch for volatility as funds may look to take profits off the table ahead of the meeting and heading into yearend (which is what may have happened upon release of the CPI data today)!
Learn more about forex trading opportunities.
Latest market news
Today 01:15 PM
Today 07:49 AM
Latest DXY articles
April 10, 2024 11:24 PM
April 8, 2024 03:35 AM
April 4, 2024 10:28 PM
April 3, 2024 02:35 AM