


January 8, 2021 11:30 AM
US NFP not so bad; Canadian Employment Change even better: USD/CAD
The US Non-Farm Payrolls reports showed that the US economy lost 140,000 jobs during the month of December vs an expectation of +71,000. However, the revision to the November print was +336,000, and increase of 91,000. Because of the revision, the NET NFP number for December was -49,000. Therefore, although the December print is still negative, it’s not as bad as it appears at first glance.
Similarly, the Canadian Employment change showed that Canada lost 62,600 jobs during the month December vs an expectation of -27,500. However, Canada breaks down their jobs data between full time employment change and part time employment change. The full-time employment change for December was +36,500, while the part time employment change was -99,000! Therefore, although the headline number was weaker than expected, the increase in full time employment shows this data print is not as bad as it appears at first glance.
We noted the Currency pair of the week that USD/CAD was one to watch due to the employment data today. On a longer-term timeframe USD/CAD remains relatively unchanged on the week and is still in a descending wedge. As price approaches the apex, the breakout of this pattern is typically to the upside and the target is a 100% retracement of the wedge, which is 1.3390. The pair held wedge support so far this week at 1.2630, which is the lowest level since April 2018. Also recall that on the longer-term timeframe, USD/CAD is highly correlated with the price of crude oil. Keep an eye on WTI for possible direction in USD/CAD over the long term.
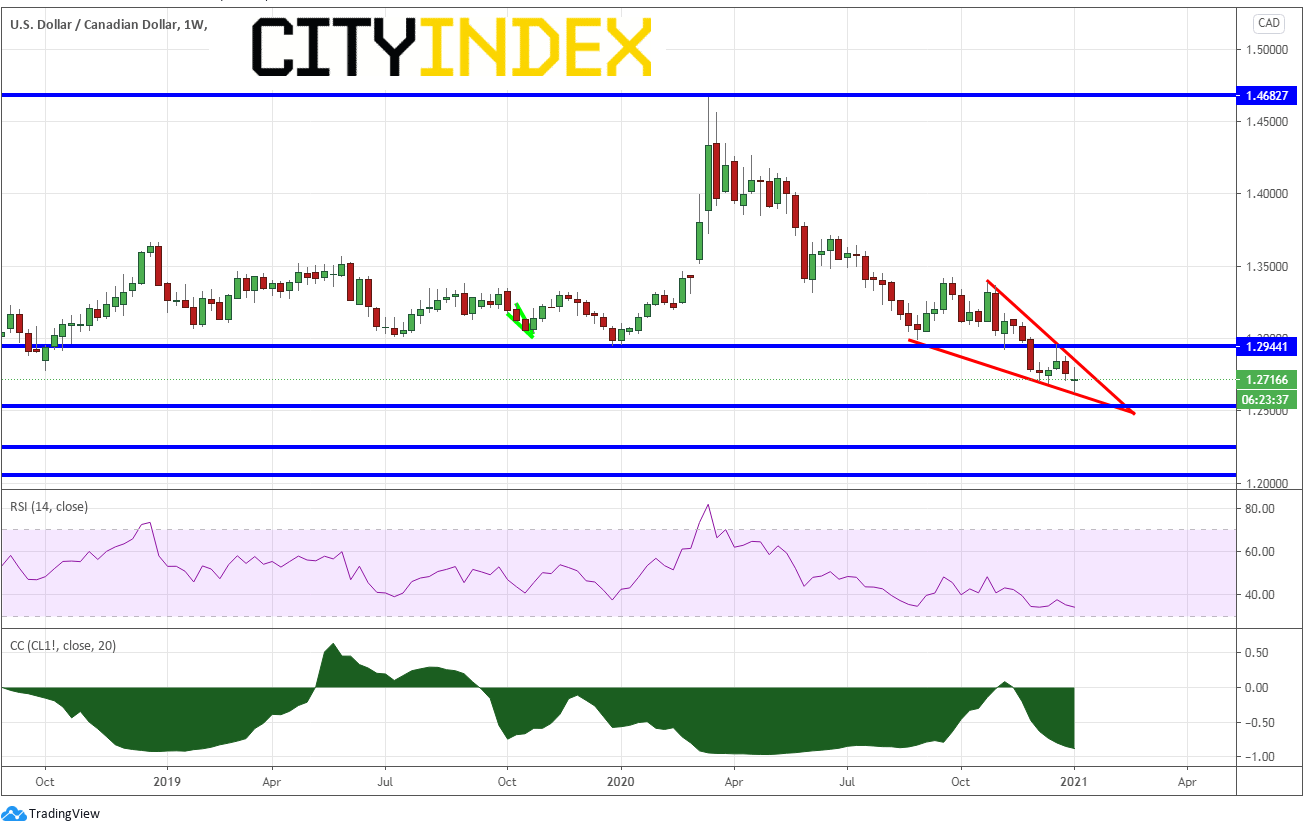
Source: Tradingview, City Index
On a 240-minute timeframe, the divergence between the RSI and price is playing out as the US Dollar surges today (since the opening of the stock market, DXY has gone from 89.66 to near today’s previous highs of 90.09). First resistance in USD/CAD is at yesterday’s highs of 1.2733. Above there is horizontal resistance and the 38.2% Fibonacci retracement from the December 21st highs to the January 6th lows at 1.2750/1.2775, and then the downward sloping trendline of the descending wedge (on the weekly) near 1.2850. Support is at todays lows of 1.2658, then the January 6th lows at 1.2630.
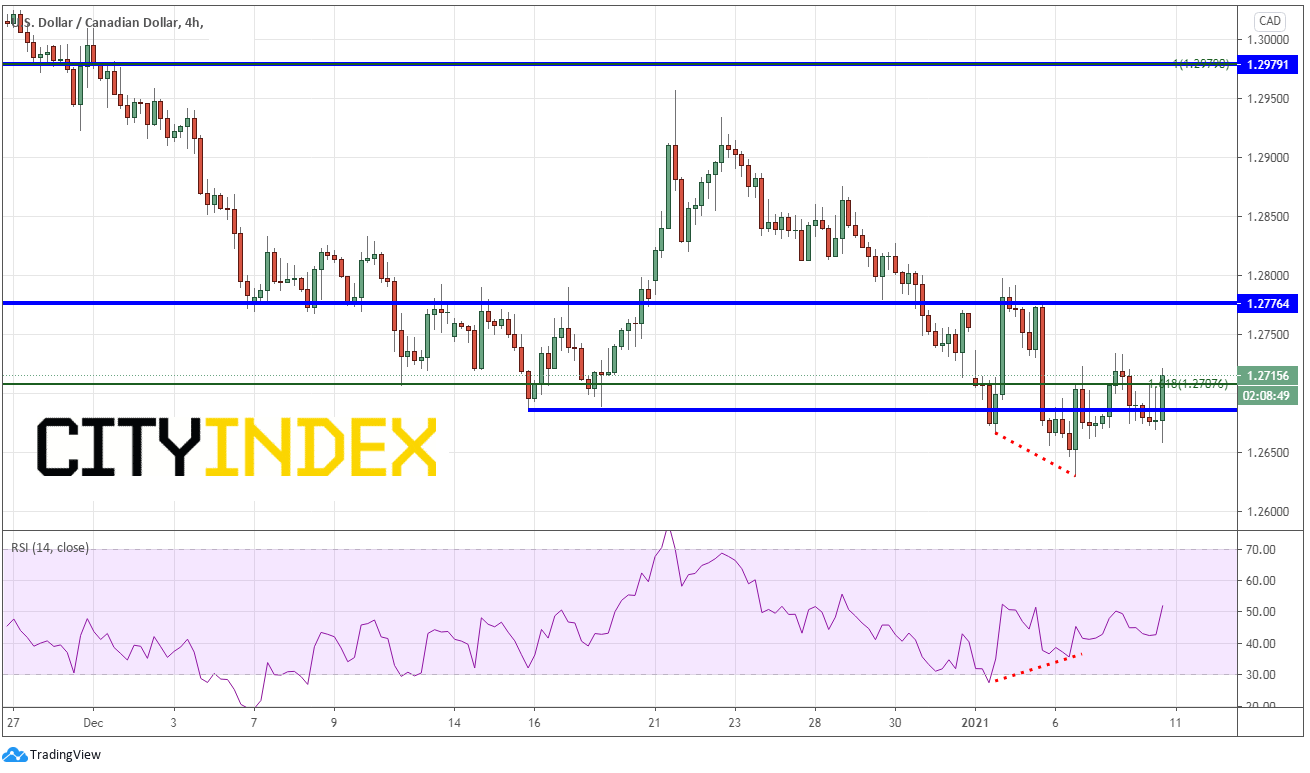
Source: Tradingview, City Index
Although the jobs reports from the neighboring countries were negative today, both were better than the headlines suggest, once the data is broken down. Although the USD/CAD has been in a long-term down trend, the doji candle on a weekly timeframe shows that the market is undecided at this point in the weekly descending wedge and bulls may be ready to push the pair higher!
Learn more about forex trading opportunities.
Latest market news
Yesterday 08:33 AM
Latest CAD articles
March 23, 2023 07:33 PM
March 13, 2023 02:54 PM
February 21, 2023 02:21 PM
February 17, 2023 04:05 PM