US investors look for a floor nearby
The S&P 500 is now on course for its longest losing streak since 2008, in the wake of news late last week that the FBI was reopening its ‘emailgate’ enquiry, tipping the US election race into uncertainty.
The S&P 500 is now on course for its longest losing streak since 2008, in the wake of news late last week that the FBI was reopening its ‘emailgate’ enquiry, tipping the US election race into uncertainty.
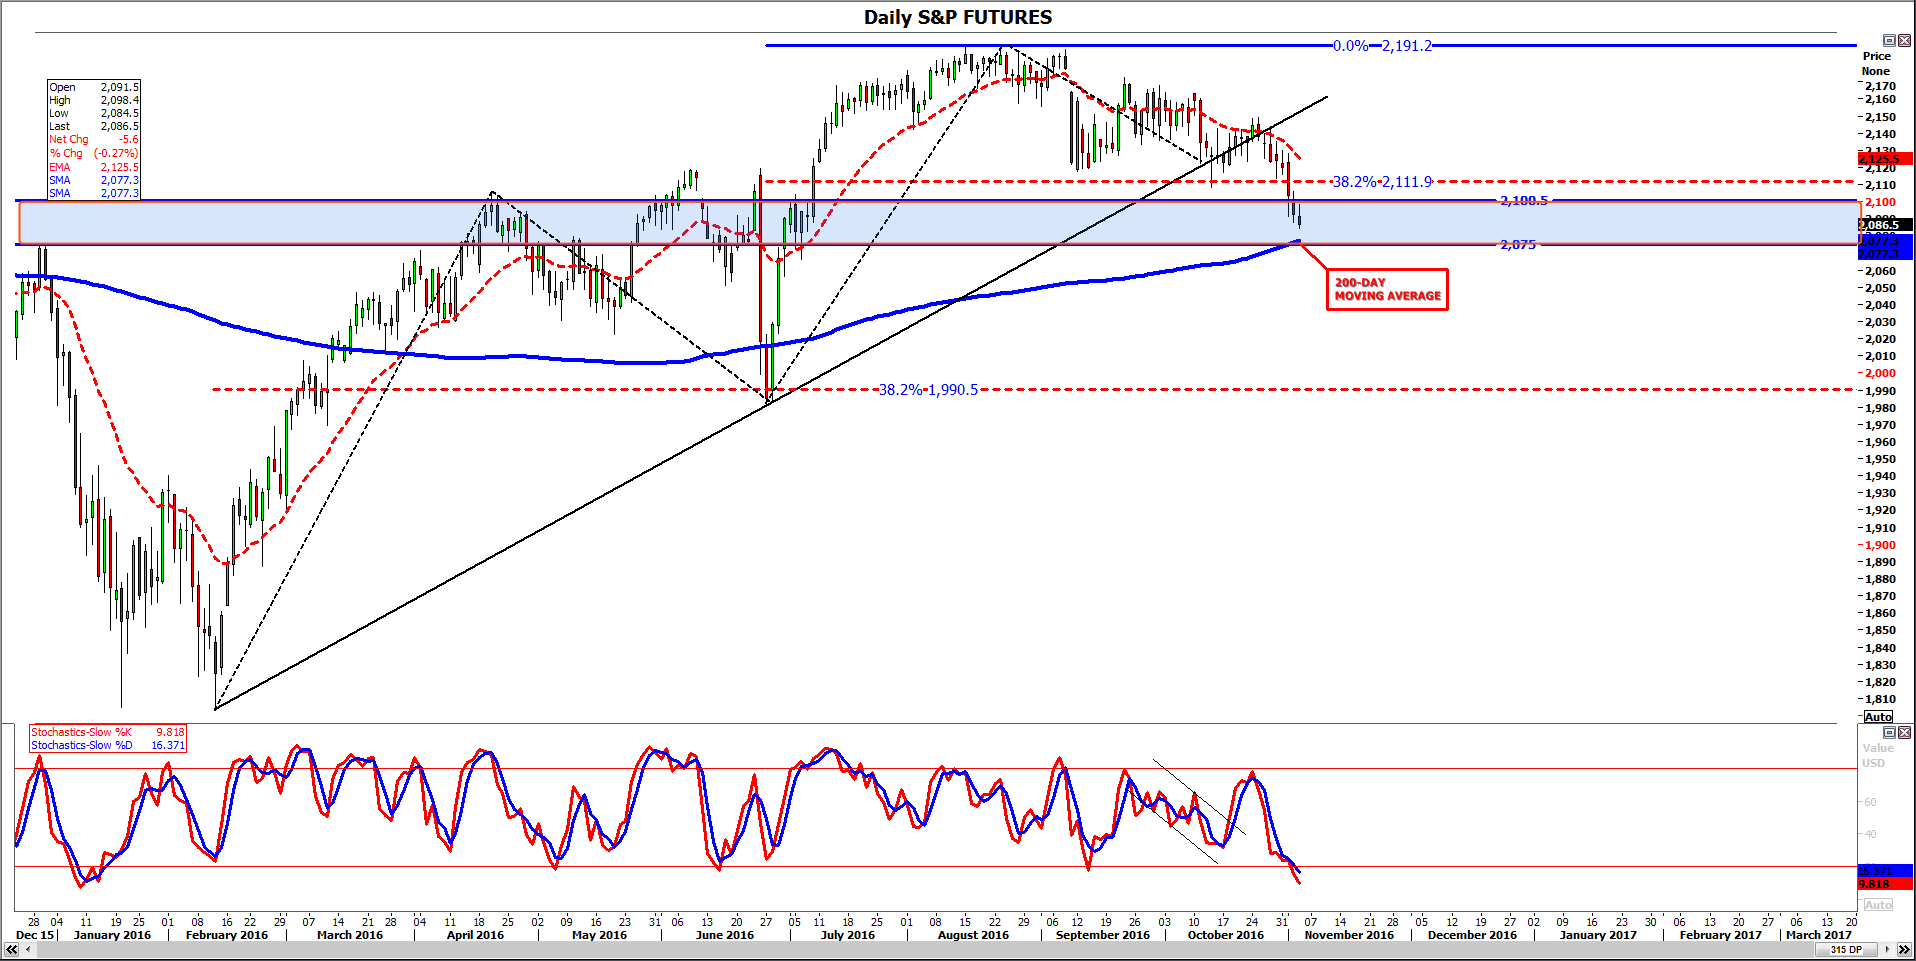
Hopes that the index would bounce at a closely watched support comprised of a 38.2% retracement of its most recent strong up-leg have proved to be forlorn.
In fact, looking at the chart for one of the most liquid, tradeable derivatives of the benchmark, its futures contract, the market has overshot and is now eyeing the next likely support zone (formerly resistance) 2075-2100, where its last rising phase kicked off in June.
Typically passive, the ‘fear gauge’ sprang back into life this week after prospects of the Democratic candidate Hillary Clinton—widely perceived to be more ‘market friendly’—appeared to take a step back, as her lead in most polls narrowed amid renewed FBI scrutiny.
The VIX tagged the 20 level again on Thursday. It was the second touch in days of a mark U.S. investors commonly see as the threshold of widespread risk aversion.
A look at the the U.S. stock market’s advance/decline ratio showed the bearish tendency was broad-based, with a ratio of as much as 1:5 in favour of fallers, according to a snapshot of New York Stock Exchange data taken earlier this week.
The line, currently around 2077 (blue in the chart below), has been gently pointing higher since June, and continues to do so, suggesting buying momentum may require longer to exhaust, regardless of the deepening reversal.
However, should both the aforementioned support zone and moving average fail to support the market, a sharper fall—perhaps to this summer’s 1981 low—could be on the cards.
Please click image to enlarge
